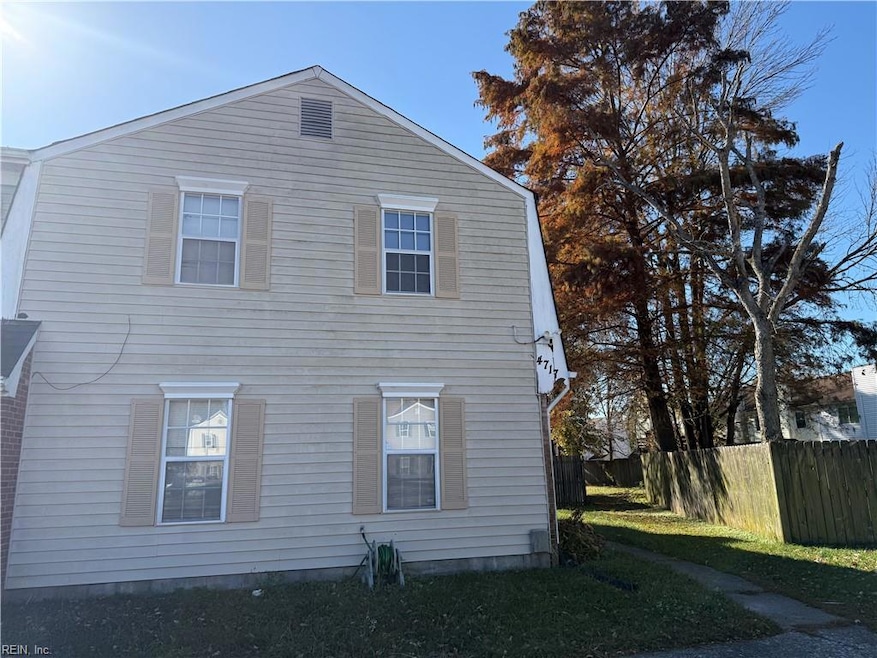
4717 Whitetail Ct Virginia Beach, VA 23464
Estimated payment $1,282/month
Highlights
- 1 Fireplace
- Ceramic Tile Flooring
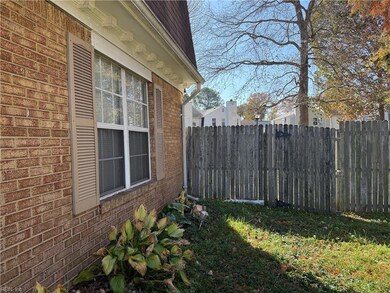
- Privacy Fence
- Salem Middle School Rated A
- Forced Air Heating and Cooling System
About This Home
With a little TLC, this property can truly shine again – ready for investors, DIY enthusiasts, or anyone looking for a fixer-upper to make their own. Enjoy the benefits of an end unit with additional yard space, natural light, and a flexible layout ready to be customized to your style. Don’t miss your chance to bring new life to this well-located gem and build equity in one of Virginia Beach’s most convenient communities!
Townhouse Details
Home Type
- Townhome
Est. Annual Taxes
- $2,436
Year Built
- Built in 1983
Lot Details
- 3,271 Sq Ft Lot
- Privacy Fence
- Back Yard Fenced
HOA Fees
- $30 Monthly HOA Fees
Home Design
- Slab Foundation
- Composition Roof
- Shingle Siding
- Vinyl Siding
Interior Spaces
- 1,760 Sq Ft Home
- 2-Story Property
- 1 Fireplace
- Washer and Dryer Hookup
Kitchen
- Electric Range
- Disposal
Flooring
- Carpet
- Ceramic Tile
Bedrooms and Bathrooms
- 3 Bedrooms
Parking
- Parking Available
- Driveway
Schools
- Indian Lakes Elementary School
- Salem Middle School
- Salem High School
Utilities
- Forced Air Heating and Cooling System
- Heat Pump System
- Electric Water Heater
Community Details
- Indian Lakes Subdivision
Map
Home Values in the Area
Average Home Value in this Area
Tax History
| Year | Tax Paid | Tax Assessment Tax Assessment Total Assessment is a certain percentage of the fair market value that is determined by local assessors to be the total taxable value of land and additions on the property. | Land | Improvement |
|---|---|---|---|---|
| 2025 | $2,436 | $278,300 | $81,000 | $197,300 |
| 2024 | $2,436 | $251,100 | $81,000 | $170,100 |
| 2023 | $2,367 | $239,100 | $78,100 | $161,000 |
| 2022 | $2,194 | $221,600 | $68,000 | $153,600 |
| 2021 | $1,938 | $195,800 | $59,000 | $136,800 |
| 2020 | $1,830 | $179,900 | $53,000 | $126,900 |
| 2019 | $1,816 | $173,100 | $50,000 | $123,100 |
| 2018 | $1,735 | $173,100 | $50,000 | $123,100 |
| 2017 | $1,646 | $164,200 | $48,000 | $116,200 |
| 2016 | $1,495 | $151,000 | $44,000 | $107,000 |
| 2015 | $1,415 | $142,900 | $44,000 | $98,900 |
| 2014 | $1,376 | $152,400 | $48,000 | $104,400 |
Property History
| Date | Event | Price | List to Sale | Price per Sq Ft |
|---|---|---|---|---|
| 12/08/2025 12/08/25 | Pending | -- | -- | -- |
| 11/14/2025 11/14/25 | Price Changed | $200,000 | +900.0% | $114 / Sq Ft |
| 11/14/2025 11/14/25 | For Sale | $20,000 | -- | $11 / Sq Ft |
Purchase History
| Date | Type | Sale Price | Title Company |
|---|---|---|---|
| Warranty Deed | $153,000 | -- | |
| Deed | $88,500 | -- | |
| Deed | $70,900 | -- | |
| Deed | $79,928 | -- |
Mortgage History
| Date | Status | Loan Amount | Loan Type |
|---|---|---|---|
| Open | $150,228 | FHA | |
| Previous Owner | $88,500 | No Value Available | |
| Previous Owner | $750,000 | No Value Available |
Source: Real Estate Information Network (REIN)
MLS Number: 10609805
APN: 1475-27-0321
Disclaimer: Certain information contained herein is derived from information provided by parties other than Homes.com. All information provided is deemed reliable, but is not guaranteed to be accurate and should be independently verified.
![]() The listings data displayed on this medium comes in part from the Real Estate Information Network, Inc. (REIN) and has been authorized by participating listing Broker Members of REIN for display. REIN's listings are based upon Data submitted by its Broker Members, and REIN therefore makes no representation or warranty regarding the accuracy of the Data. All users of REIN's listings database should confirm the accuracy of the listing information directly with the listing agent.
The listings data displayed on this medium comes in part from the Real Estate Information Network, Inc. (REIN) and has been authorized by participating listing Broker Members of REIN for display. REIN's listings are based upon Data submitted by its Broker Members, and REIN therefore makes no representation or warranty regarding the accuracy of the Data. All users of REIN's listings database should confirm the accuracy of the listing information directly with the listing agent.
Copyright 2025 REIN. REIN's listings Data and information is protected under federal copyright laws. Federal law prohibits, among other acts, the unauthorized copying or alteration of, or preparation of derivative works from, all or any part of copyrighted materials, including certain compilations of Data and information. COPYRIGHT VIOLATORS MAY BE SUBJECT TO SEVERE FINES AND PENALTIES UNDER FEDERAL LAW.
REIN updates its listings on a daily basis.
Some listings may be duplicated in the search results due to the co-mingling of listings from more than one multiple listing service. Should there be different listing information between the duplicated listings; user is advised to verify the accuracy of the listing information before making any financial decisions.
Some or all of the listings (or listings Data) represented in this application have been enhanced with Data not provided by REIN. The enhancements are as follows: mapping, demographics, and economics. The source of these enhancements are: GreatSchools, CoStar, Google, Walk Score, How Loud, Collateral Analytics, Black Knight, First American, and Quantarium.
This application does not include information on all of the properties available for sale at this time.
- 4737 Greenlaw Dr
- 1505 Hadley Ct
- 4706 Greenlaw Dr
- 1613 Cliffwood Dr
- 1224 Cherry Blossom Ct
- 1237 Heathcliff Dr
- 1221 Hartford Dr
- 4916 Hillswick Dr
- 1220 Heathcliff Dr
- 4968 Montrose Dr
- 4521 Van Dyck Dr
- 4829 Rugby Rd
- 1425 Round Hill Dr
- 1374 Orillia Rd
- 4729 Berrywood Rd
- 1145 Amy Dr
- 5131 Rugby Rd
- 1617 Sweet Bay Ct
- 1116 Newmarket Dr
- 5008 Christian Cir
