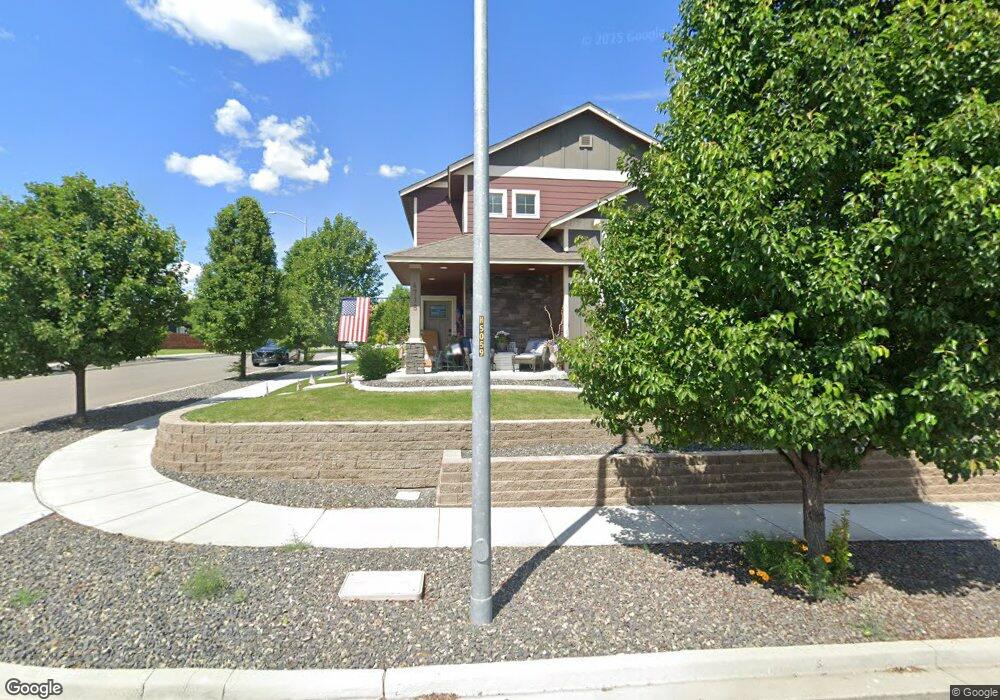
4718 Corvina St Unit Badger Mountain Sout Richland, WA 99352
Estimated Value: $504,000 - $579,000
4
Beds
3
Baths
2,114
Sq Ft
$252/Sq Ft
Est. Value
About This Home
This home is located at 4718 Corvina St Unit Badger Mountain Sout, Richland, WA 99352 and is currently estimated at $532,381, approximately $251 per square foot. 4718 Corvina St Unit Badger Mountain Sout is a home located in Benton County with nearby schools including White Bluffs Elementary School, Enterprise Middle School, and Richland High School.
Ownership History
Date
Name
Owned For
Owner Type
Purchase Details
Closed on
Sep 30, 2019
Sold by
Pfenning Josh
Bought by
Fetto Angela Marie
Current Estimated Value
Home Financials for this Owner
Home Financials are based on the most recent Mortgage that was taken out on this home.
Original Mortgage
$319,113
Outstanding Balance
$279,559
Interest Rate
3.5%
Mortgage Type
FHA
Estimated Equity
$252,822
Purchase Details
Closed on
Jul 29, 2016
Sold by
Viking Builders Llc
Bought by
Pfenning Josh
Home Financials for this Owner
Home Financials are based on the most recent Mortgage that was taken out on this home.
Original Mortgage
$267,997
Interest Rate
3.54%
Mortgage Type
New Conventional
Purchase Details
Closed on
Jul 14, 2015
Sold by
Badger Mountain South Development Llc
Bought by
Viking Builders Llc
Create a Home Valuation Report for This Property
The Home Valuation Report is an in-depth analysis detailing your home's value as well as a comparison with similar homes in the area
Home Values in the Area
Average Home Value in this Area
Purchase History
| Date | Buyer | Sale Price | Title Company |
|---|---|---|---|
| Fetto Angela Marie | $378,105 | Chicago Title Company Of Wa | |
| Pfenning Josh | $278,746 | Stewart Title Company | |
| Viking Builders Llc | $86,519 | Frontier Title & Escrow Co |
Source: Public Records
Mortgage History
| Date | Status | Borrower | Loan Amount |
|---|---|---|---|
| Open | Fetto Angela Marie | $319,113 | |
| Previous Owner | Pfenning Josh | $267,997 |
Source: Public Records
Tax History Compared to Growth
Tax History
| Year | Tax Paid | Tax Assessment Tax Assessment Total Assessment is a certain percentage of the fair market value that is determined by local assessors to be the total taxable value of land and additions on the property. | Land | Improvement |
|---|---|---|---|---|
| 2024 | $4,252 | $455,380 | $100,000 | $355,380 |
| 2023 | $4,252 | $455,380 | $100,000 | $355,380 |
| 2022 | $3,424 | $350,050 | $55,000 | $295,050 |
| 2021 | $3,137 | $309,230 | $55,000 | $254,230 |
| 2020 | $3,429 | $271,570 | $55,000 | $216,570 |
| 2019 | $3,082 | $280,980 | $55,000 | $225,980 |
| 2018 | $3,572 | $271,570 | $55,000 | $216,570 |
| 2017 | $2,726 | $262,150 | $55,000 | $207,150 |
| 2016 | $550 | $226,090 | $45,750 | $180,340 |
| 2015 | $540 | $45,750 | $45,750 | $0 |
| 2014 | -- | $44,000 | $44,000 | $0 |
| 2013 | -- | $44,000 | $44,000 | $0 |
Source: Public Records
Map
Nearby Homes
- 4815 Corvina St
- 3913 Barbera St
- Lot 223 Desert Sky
- Lot 224 Desert Sky
- Lot 225 Desert Sky
- Lot 226 Desert Sky
- Lot 222 Desert Sky
- Lot 221 Desert Sky
- NKA Ava Way (Parcel C)
- Lot 228 Desert Sky
- 4356 Corvina St
- 2883 Savanna Ave
- 2831 Savanna Ave
- 2875 Savanna Ave
- NKA Dallas Rd (B6)
- NKA
- NKA Dallas Rd (B2)
- 2256 Sevilla Ct
- 2839 Savanna Ave
- NKA Dallas Rd (B5)
- 4718 Corvina St
- 4718 Corvina St Unit Viking Builders in W
- 4706 Corvina St
- 4706 Corvina St Unit Viking Builders in W
- 4682 Corvina St
- 4682 Corvina St Unit Viking Builders in W
- 4730 Corvina St
- 4646 Corvina St
- 4646 Corvina St Unit Viking Builders in W
- 4646 Corvina St Unit The Hemlock by Vikin
- 4711 Corvina St
- 2223 Tawny Ave
- 4723 Corvina St
- 4754 Corvina St
- 4743 Highview St
- 2251 Camillia Ave Unit $5000 Closing Costs
- 2251 Camillia Ave
- 2251 Camillia Ave Unit Geo-Thermal Heating
- 2251 Camilla Ave
- 4634 Corvina St