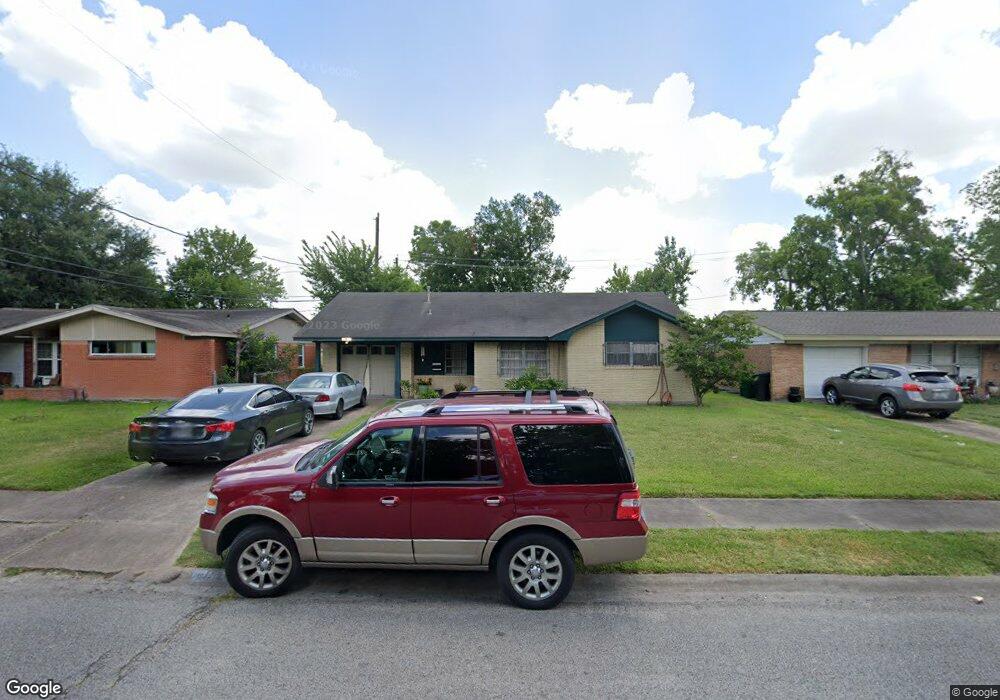
4718 Marable Dr Houston, TX 77022
Independence Heights NeighborhoodEstimated Value: $169,000 - $222,000
3
Beds
1
Bath
1,181
Sq Ft
$167/Sq Ft
Est. Value
About This Home
This home is located at 4718 Marable Dr, Houston, TX 77022 and is currently estimated at $197,130, approximately $166 per square foot. 4718 Marable Dr is a home located in Harris County with nearby schools including Kennedy Elementary School, Williams Middle, and Booker T Washington Sr High.
Ownership History
Date
Name
Owned For
Owner Type
Purchase Details
Closed on
Oct 18, 1999
Sold by
Reiner Howard
Bought by
Pipkins Tharner J and Austin Pipkins Doris
Current Estimated Value
Home Financials for this Owner
Home Financials are based on the most recent Mortgage that was taken out on this home.
Original Mortgage
$37,000
Outstanding Balance
$11,232
Interest Rate
7.9%
Mortgage Type
VA
Estimated Equity
$185,898
Purchase Details
Closed on
Mar 23, 1999
Sold by
Russo Charlotte Anderson and Platz Lynda Carroll Anderson
Bought by
Anderson Linda L
Create a Home Valuation Report for This Property
The Home Valuation Report is an in-depth analysis detailing your home's value as well as a comparison with similar homes in the area
Home Values in the Area
Average Home Value in this Area
Purchase History
| Date | Buyer | Sale Price | Title Company |
|---|---|---|---|
| Pipkins Tharner J | -- | Chicago Title | |
| Anderson Linda L | -- | -- |
Source: Public Records
Mortgage History
| Date | Status | Borrower | Loan Amount |
|---|---|---|---|
| Open | Pipkins Tharner J | $37,000 |
Source: Public Records
Tax History Compared to Growth
Tax History
| Year | Tax Paid | Tax Assessment Tax Assessment Total Assessment is a certain percentage of the fair market value that is determined by local assessors to be the total taxable value of land and additions on the property. | Land | Improvement |
|---|---|---|---|---|
| 2025 | $2,774 | $184,425 | $115,290 | $69,135 |
| 2024 | $2,774 | $187,145 | $115,290 | $71,855 |
| 2023 | $2,774 | $163,008 | $92,232 | $70,776 |
| 2022 | $2,756 | $153,585 | $92,232 | $61,353 |
| 2021 | $2,652 | $142,759 | $92,232 | $50,527 |
| 2020 | $2,505 | $114,221 | $46,116 | $68,105 |
| 2019 | $2,380 | $111,275 | $46,116 | $65,159 |
| 2018 | $0 | $87,621 | $26,901 | $60,720 |
| 2017 | $1,965 | $87,621 | $26,901 | $60,720 |
| 2016 | $1,787 | $85,492 | $19,215 | $66,277 |
| 2015 | -- | $69,338 | $19,215 | $50,123 |
| 2014 | -- | $59,069 | $19,215 | $39,854 |
Source: Public Records
Map
Nearby Homes
- 510 Victoria Dr
- 627 Glenburnie Dr
- 5035 North Fwy
- 4440 Castor St
- 600 E Whitney St
- Cypress Plan at Wellford Village
- Willow Plan at Wellford Village
- 423 Gammon Dr
- 0 Victoria Unit 54691087
- 312 Walthall Dr
- 4402 Airline Dr
- 330 Spell St
- 4309 Delhi St
- 4311 Busiek St
- 310 Walthall Dr
- 4305 Castor St
- 4311 Europa St
- 26 Farrell St
- 315 E Whitney St
- 4303 Castor Na St
- 4722 Marable Dr
- 4714 Marable Dr
- 4710 Marable Dr
- 4726 Marable Dr
- 4706 Marable Dr
- 4730 Marable Dr
- 4723 Marable Dr
- 631 Nest Ln
- 4727 Marable Dr
- 4734 Marable Dr
- 4702 Marable Dr
- 4707 Marable Dr
- 642 Feamster Dr
- 623 Nest Ln
- 4738 Marable Dr
- 638 Feamster Dr
- 4703 Marable Dr
- 615 Nest Ln
- 634 Feamster Dr
- 4742 Marable Dr