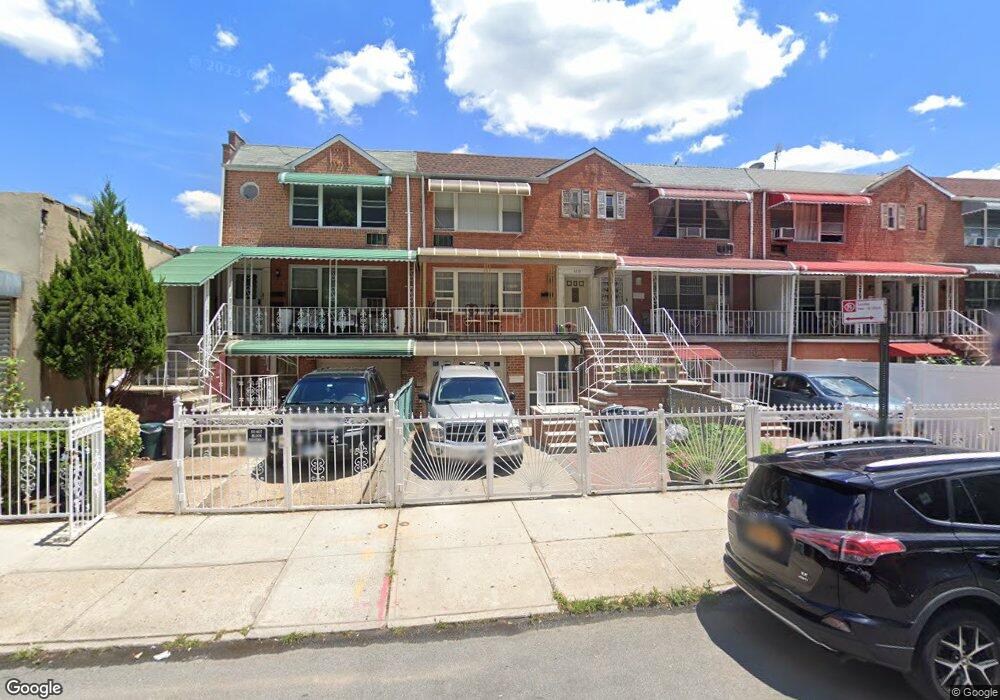
4719 49th St Woodside, NY 11377
Sunnyside NeighborhoodEstimated Value: $1,242,000 - $1,684,000
--
Bed
--
Bath
2,920
Sq Ft
$503/Sq Ft
Est. Value
About This Home
This home is located at 4719 49th St, Woodside, NY 11377 and is currently estimated at $1,467,333, approximately $502 per square foot. 4719 49th St is a home located in Queens County with nearby schools including The Children's Lab School, William Cullen Bryant High School, and Razi School.
Ownership History
Date
Name
Owned For
Owner Type
Purchase Details
Closed on
Jun 26, 2023
Sold by
Chavez David Elvis and Chavez Deceased
Bought by
Khan Muhammad A and Tabassum Khan Farah
Current Estimated Value
Home Financials for this Owner
Home Financials are based on the most recent Mortgage that was taken out on this home.
Original Mortgage
$920,000
Outstanding Balance
$896,375
Interest Rate
6.39%
Mortgage Type
Purchase Money Mortgage
Estimated Equity
$570,958
Purchase Details
Closed on
Aug 5, 1997
Sold by
Davis Lou Ellen
Bought by
Chavez Hector and Chavez Margarita
Home Financials for this Owner
Home Financials are based on the most recent Mortgage that was taken out on this home.
Original Mortgage
$251,750
Interest Rate
7.47%
Mortgage Type
Purchase Money Mortgage
Create a Home Valuation Report for This Property
The Home Valuation Report is an in-depth analysis detailing your home's value as well as a comparison with similar homes in the area
Home Values in the Area
Average Home Value in this Area
Purchase History
| Date | Buyer | Sale Price | Title Company |
|---|---|---|---|
| Khan Muhammad A | $1,320,000 | -- | |
| Khan Muhammad A | $1,320,000 | -- | |
| Chavez Hector | $265,000 | First American Title Ins Co | |
| Chavez Hector | $265,000 | First American Title Ins Co |
Source: Public Records
Mortgage History
| Date | Status | Borrower | Loan Amount |
|---|---|---|---|
| Open | Khan Muhammad A | $920,000 | |
| Closed | Khan Muhammad A | $920,000 | |
| Previous Owner | Chavez Hector | $251,750 |
Source: Public Records
Tax History Compared to Growth
Tax History
| Year | Tax Paid | Tax Assessment Tax Assessment Total Assessment is a certain percentage of the fair market value that is determined by local assessors to be the total taxable value of land and additions on the property. | Land | Improvement |
|---|---|---|---|---|
| 2025 | $11,321 | $59,682 | $9,901 | $49,781 |
| 2024 | $11,321 | $56,364 | $9,111 | $47,253 |
| 2023 | $10,761 | $53,578 | $7,370 | $46,208 |
| 2022 | $10,409 | $78,120 | $12,900 | $65,220 |
| 2021 | $10,799 | $75,960 | $12,900 | $63,060 |
| 2020 | $10,231 | $82,500 | $12,900 | $69,600 |
| 2019 | $9,533 | $76,560 | $12,900 | $63,660 |
| 2018 | $8,804 | $44,648 | $10,245 | $34,403 |
| 2017 | $8,802 | $44,648 | $11,201 | $33,447 |
| 2016 | $8,473 | $44,648 | $11,201 | $33,447 |
| 2015 | $4,860 | $41,446 | $11,092 | $30,354 |
| 2014 | $4,860 | $39,142 | $10,917 | $28,225 |
Source: Public Records
Map
Nearby Homes
- 45-51 47th St
- 4529 47th St Unit 2B
- 45-29 47th St Unit 4-A
- 45-29 47th St Unit 2-A
- 45-29 47th St Unit 5-A
- 45-29 47th St Unit 3-B
- 45-29 47th St Unit 6-A
- 45-29 47th St Unit 4-B
- 45-29 47th St Unit 5-B
- 45-29 47th St Unit 3-A
- 45-29 47th St Unit 2-B
- 47-37 45th St Unit 2A
- 43-33 48th St Unit 6 A
- 43-33 48th St Unit 6D
- 43-33 48th St Unit A
- 43-33 48th St Unit 4J
- 4333 48th St Unit 1B
- 4333 48th St Unit 3B
- 4333 48th St Unit 4H
- 4333 48th St Unit 4A
- 4721 49th St
- 4717 49th St
- 47-21 49th St
- 4723 49th St
- 4715 49th St
- 4725 49th St
- 4725 49th St Unit 2
- 4725 49th St Unit 2nd Fl
- 4725 49th St Unit 2
- 4725 49th St
- 4725 49th St
- 4727 49th St
- 4729 49th St
- 4731 49th St
- 49-10 47th Ave
- 47-16 49th St Unit 4H
- 47-16 49th St Unit 1B
- 47-16 49th St Unit 2H
- 47-16 49th St Unit 5F
- 47-16 49th St Unit 4G