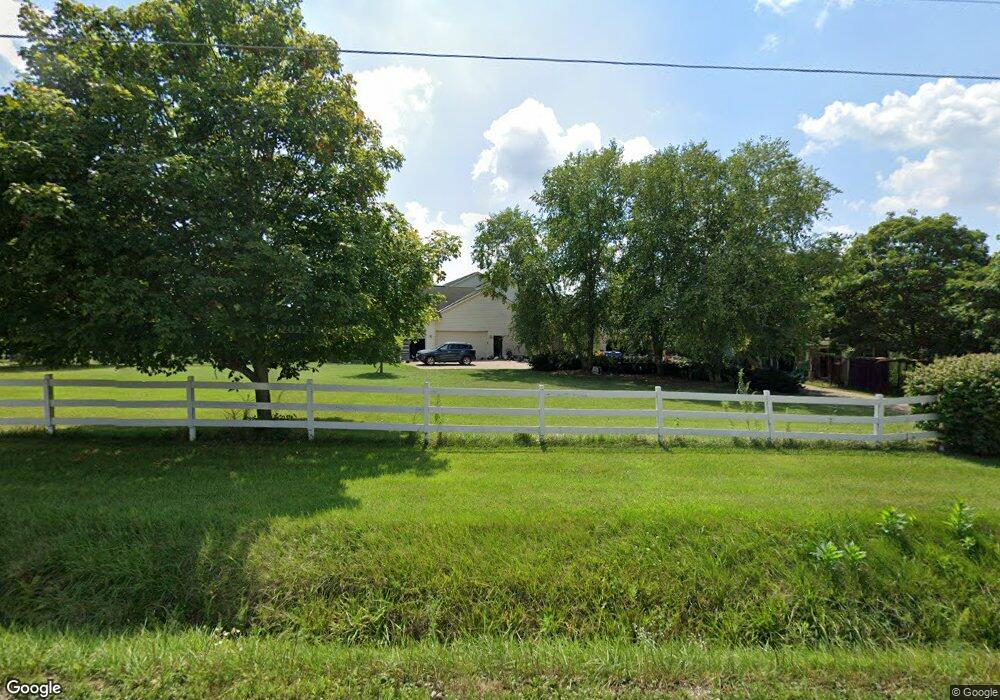
4719 Clark Shaw Rd Powell, OH 43065
Concord NeighborhoodEstimated Value: $719,869 - $816,000
3
Beds
4
Baths
3,593
Sq Ft
$212/Sq Ft
Est. Value
About This Home
This home is located at 4719 Clark Shaw Rd, Powell, OH 43065 and is currently estimated at $762,717, approximately $212 per square foot. 4719 Clark Shaw Rd is a home located in Delaware County with nearby schools including Buckeye Valley High School and The Emilia School.
Ownership History
Date
Name
Owned For
Owner Type
Purchase Details
Closed on
Apr 22, 2011
Sold by
Henniger Jay L and Henniger Deeann M
Bought by
Warner Karen E
Current Estimated Value
Home Financials for this Owner
Home Financials are based on the most recent Mortgage that was taken out on this home.
Original Mortgage
$283,594
Outstanding Balance
$196,202
Interest Rate
4.86%
Mortgage Type
Purchase Money Mortgage
Estimated Equity
$566,515
Purchase Details
Closed on
Nov 4, 2008
Sold by
Potts Gary and Potts Elizabeth
Bought by
Henniger Jay L and Henniger Deeann M
Home Financials for this Owner
Home Financials are based on the most recent Mortgage that was taken out on this home.
Original Mortgage
$280,000
Interest Rate
5.14%
Mortgage Type
Purchase Money Mortgage
Purchase Details
Closed on
Nov 27, 2001
Sold by
Trst Dennis C Erwin
Bought by
Potts Gary and Potts Elizabeth
Home Financials for this Owner
Home Financials are based on the most recent Mortgage that was taken out on this home.
Original Mortgage
$51,920
Interest Rate
6.62%
Mortgage Type
New Conventional
Create a Home Valuation Report for This Property
The Home Valuation Report is an in-depth analysis detailing your home's value as well as a comparison with similar homes in the area
Home Values in the Area
Average Home Value in this Area
Purchase History
| Date | Buyer | Sale Price | Title Company |
|---|---|---|---|
| Warner Karen E | $354,500 | Talon Title | |
| Henniger Jay L | $350,000 | Fidelity National Title | |
| Potts Gary | $64,900 | -- |
Source: Public Records
Mortgage History
| Date | Status | Borrower | Loan Amount |
|---|---|---|---|
| Open | Warner Karen E | $283,594 | |
| Previous Owner | Henniger Jay L | $280,000 | |
| Previous Owner | Potts Gary | $51,920 |
Source: Public Records
Tax History Compared to Growth
Tax History
| Year | Tax Paid | Tax Assessment Tax Assessment Total Assessment is a certain percentage of the fair market value that is determined by local assessors to be the total taxable value of land and additions on the property. | Land | Improvement |
|---|---|---|---|---|
| 2024 | $6,900 | $199,260 | $50,750 | $148,510 |
| 2023 | $6,893 | $199,260 | $50,750 | $148,510 |
| 2022 | $6,062 | $158,170 | $31,960 | $126,210 |
| 2021 | $6,064 | $158,170 | $31,960 | $126,210 |
| 2020 | $6,102 | $158,170 | $31,960 | $126,210 |
| 2019 | $5,243 | $124,470 | $26,640 | $97,830 |
| 2018 | $5,326 | $124,470 | $26,640 | $97,830 |
| 2017 | $4,979 | $118,380 | $20,900 | $97,480 |
| 2016 | $4,751 | $118,380 | $20,900 | $97,480 |
| 2015 | $5,003 | $118,380 | $20,900 | $97,480 |
| 2014 | $4,715 | $118,380 | $20,900 | $97,480 |
| 2013 | $4,689 | $113,720 | $20,900 | $92,820 |
Source: Public Records
Map
Nearby Homes
- 5310 S Section Line Rd
- 5968 S Section Line Rd
- 4161 Clark Shaw Rd
- 4132 Bluebird Dr
- 4040 Clark Shaw Rd
- 6299 S Section Line Rd
- 0 S Section Line Rd Unit Tract 6 225024549
- 0 S Section Line Rd Unit Tract 5 225024546
- 0 S Section Line Rd Unit Tract 4B 225024545
- 0 S Section Line Rd Unit Tract 4A 225024542
- 0 S Section Line Rd Unit Tract 3 225024539
- 0 S Section Line Rd Unit Tract 2B 225024538
- 0 S Section Line Rd Unit Tract 2A 225024534
- 0 S Section Line Rd Unit Tract 1 225024531
- 5229 Bean Oller Rd
- 5701 Dublin Rd
- 4142 Pyke Dr
- The Iris Residence Plan at Reserve at Scioto Bluff
- Scarlett Custom Plan A at Reserve at Scioto Bluff
- Kline Residence Plan at Reserve at Scioto Bluff
- 5678 S Section Line Rd
- 4659 Clark Shaw Rd
- 5621 S Section Line Rd
- 4664 Clark Shaw Rd
- 4617 Clark Shaw Rd
- 5701 S Section Line Rd
- 5740 S Section Line Rd
- 5705 S Section Line Rd
- 4600 Clark Shaw Rd
- 5505 S Section Line Rd
- 5757 S Section Line Rd
- 4745 Clark Shaw Rd
- 4572 Clark Shaw Rd
- 4901 Clark Shaw Rd
- 4635 Clark Shaw Rd
- 5439 S Section Line Rd
- 4544 Clark Shaw Rd
- 5538 S Section Line Rd
- 4511 Clark Shaw Rd
- 5483 S Section Line Rd