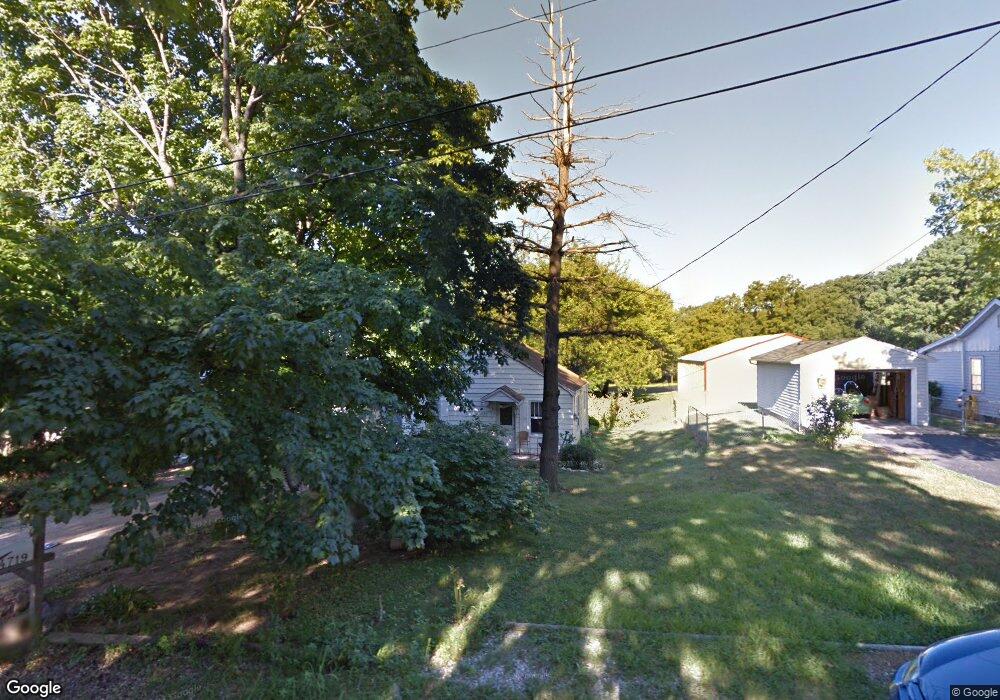
4719 N Ellen Ct Peoria Heights, IL 61616
Estimated Value: $67,567 - $81,000
2
Beds
1
Bath
576
Sq Ft
$126/Sq Ft
Est. Value
About This Home
This home is located at 4719 N Ellen Ct, Peoria Heights, IL 61616 and is currently estimated at $72,642, approximately $126 per square foot. 4719 N Ellen Ct is a home located in Peoria County with nearby schools including Peoria Heights Grade School, Peoria Heights High School, and Montessori School of Peoria.
Ownership History
Date
Name
Owned For
Owner Type
Purchase Details
Closed on
Aug 19, 2024
Sold by
Prairie Property Group Llp
Bought by
Younglove David E
Current Estimated Value
Home Financials for this Owner
Home Financials are based on the most recent Mortgage that was taken out on this home.
Original Mortgage
$64,804
Outstanding Balance
$64,054
Interest Rate
6.75%
Mortgage Type
FHA
Estimated Equity
$8,588
Purchase Details
Closed on
Jun 27, 2019
Sold by
Pegg Real Estate And Construction Inc
Bought by
Prairie Property Group Llp
Purchase Details
Closed on
Mar 28, 2019
Sold by
Pegg Real Estate And Construction Inc
Bought by
Prairie Property Group Llp
Purchase Details
Closed on
Aug 26, 2004
Bought by
Pegg Real Estate And Construction Inc
Create a Home Valuation Report for This Property
The Home Valuation Report is an in-depth analysis detailing your home's value as well as a comparison with similar homes in the area
Home Values in the Area
Average Home Value in this Area
Purchase History
| Date | Buyer | Sale Price | Title Company |
|---|---|---|---|
| Younglove David E | $66,000 | None Listed On Document | |
| Prairie Property Group Llp | -- | None Listed On Document | |
| Prairie Property Group Llp | -- | Johnson Bunce & Noble Pc | |
| Pegg Real Estate And Construction Inc | $39,000 | -- |
Source: Public Records
Mortgage History
| Date | Status | Borrower | Loan Amount |
|---|---|---|---|
| Open | Younglove David E | $64,804 |
Source: Public Records
Tax History Compared to Growth
Tax History
| Year | Tax Paid | Tax Assessment Tax Assessment Total Assessment is a certain percentage of the fair market value that is determined by local assessors to be the total taxable value of land and additions on the property. | Land | Improvement |
|---|---|---|---|---|
| 2024 | $1,466 | $17,160 | $3,700 | $13,460 |
| 2023 | $1,410 | $15,740 | $3,390 | $12,350 |
| 2022 | $1,060 | $11,550 | $3,560 | $7,990 |
| 2021 | $1,028 | $11,000 | $3,390 | $7,610 |
| 2020 | $1,049 | $10,780 | $3,320 | $7,460 |
| 2019 | $1,045 | $10,780 | $3,320 | $7,460 |
| 2018 | $1,025 | $10,640 | $3,220 | $7,420 |
| 2017 | $1,039 | $10,860 | $3,290 | $7,570 |
| 2016 | $1,019 | $10,860 | $3,290 | $7,570 |
| 2015 | $1,091 | $10,860 | $3,290 | $7,570 |
| 2014 | $1,104 | $11,760 | $3,160 | $8,600 |
| 2013 | -- | $11,820 | $3,180 | $8,640 |
Source: Public Records
Map
Nearby Homes
- 801 E Toledo Ave
- 1002 E Samuel Ave
- 5022 N Belmont Place
- 5014 N Best St
- 909 E Moneta Ave
- 513 E Moneta Ave
- 810 E Sciota Ave
- 0 E Moneta Ave
- 903 E Lake Ave
- 5128 N Roberts Rd
- 1219 E Moneta Ave
- 1310 E Samuel Ave Unit 3F
- 1310 E Samuel Ave Unit 3A
- 1310 E Samuel Ave Unit 2E
- 1224 E Moneta Ave
- 209 E Northridge Ln
- 4600 N Knoxville Ave
- 125 E Glen Ave Unit 111B
- 4012 N Boulevard Ave
- 4100 N Illinois Ave
- 4715 N Ellen Ct
- 4803 N Ellen Ct
- 4807 N Ellen Ct
- 722 E Glen Ave
- 4709 N Ellen Ct
- 4722 N Ellen Ct
- 4716 N Ellen Ct
- 4804 N Ellen Ct
- 4811 N Ellen Ct
- 4808 N Ellen Ct
- 4703 N Ellen Ct
- 724 E Glen Ave
- 4812 N Ellen Ct
- 4815 N Ellen Ct
- 720 E Glen Ave
- 810 E Glen Ave
- 800 E Glen Ave
- 4616 N Ellen Ct
- 704 E Glen Ave
- 710 E Glen Ave