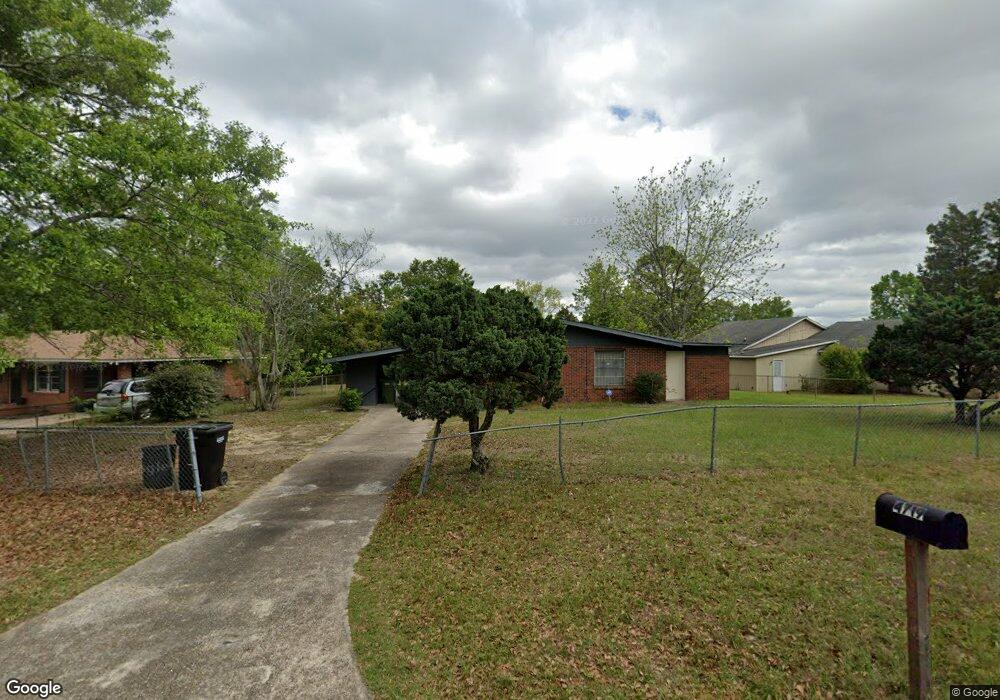
4719 Sentry St Columbus, GA 31907
East Columbus NeighborhoodEstimated Value: $84,000 - $103,000
3
Beds
2
Baths
1,092
Sq Ft
$87/Sq Ft
Est. Value
About This Home
This home is located at 4719 Sentry St, Columbus, GA 31907 and is currently estimated at $95,299, approximately $87 per square foot. 4719 Sentry St is a home located in Muscogee County with nearby schools including Rothschild Leadership Academy, Kendrick High School, and Pinehurst Christian School.
Ownership History
Date
Name
Owned For
Owner Type
Purchase Details
Closed on
Apr 18, 2024
Sold by
Maxwell Terrance
Bought by
Family Snowball Llc
Current Estimated Value
Purchase Details
Closed on
Mar 22, 2023
Sold by
Columbus 26 Partners Llc
Bought by
Macon Jh Sapir Llc
Home Financials for this Owner
Home Financials are based on the most recent Mortgage that was taken out on this home.
Original Mortgage
$2,900,000
Interest Rate
6.12%
Mortgage Type
New Conventional
Purchase Details
Closed on
Dec 21, 2021
Sold by
Cf Properties Llc
Bought by
Columbus 26 Partners Llc
Purchase Details
Closed on
Feb 5, 2021
Sold by
Lr Properties Llc
Bought by
Cf Properties Llc
Purchase Details
Closed on
Nov 16, 2015
Sold by
Wells Fargo Financial Geor
Bought by
Lr Partners Llc
Purchase Details
Closed on
Jun 2, 2015
Sold by
Hicks Luther E
Bought by
Wells Fargo Financial Georgia
Create a Home Valuation Report for This Property
The Home Valuation Report is an in-depth analysis detailing your home's value as well as a comparison with similar homes in the area
Home Values in the Area
Average Home Value in this Area
Purchase History
| Date | Buyer | Sale Price | Title Company |
|---|---|---|---|
| Family Snowball Llc | $75,000 | None Listed On Document | |
| Macon Jh Sapir Llc | $4,075,000 | -- | |
| Columbus 26 Partners Llc | $5,349,254 | -- | |
| Cf Properties Llc | $761,000 | -- | |
| Lr Partners Llc | $16,900 | -- | |
| Wells Fargo Financial Georgia | $13,680 | -- |
Source: Public Records
Mortgage History
| Date | Status | Borrower | Loan Amount |
|---|---|---|---|
| Previous Owner | Macon Jh Sapir Llc | $2,900,000 |
Source: Public Records
Tax History
| Year | Tax Paid | Tax Assessment Tax Assessment Total Assessment is a certain percentage of the fair market value that is determined by local assessors to be the total taxable value of land and additions on the property. | Land | Improvement |
|---|---|---|---|---|
| 2025 | $1,195 | $30,528 | $6,004 | $24,524 |
| 2024 | $1,195 | $30,528 | $6,004 | $24,524 |
| 2023 | $1,213 | $30,800 | $6,004 | $24,796 |
| 2022 | $944 | $23,112 | $6,004 | $17,108 |
| 2021 | $504 | $12,340 | $6,004 | $6,336 |
| 2020 | $504 | $12,340 | $6,004 | $6,336 |
| 2019 | $506 | $12,340 | $6,004 | $6,336 |
| 2018 | $689 | $19,776 | $6,004 | $13,772 |
| 2017 | $813 | $19,776 | $6,004 | $13,772 |
| 2016 | $277 | $6,722 | $1,225 | $5,497 |
| 2015 | $753 | $18,222 | $3,500 | $14,722 |
| 2014 | -- | $18,222 | $3,500 | $14,722 |
| 2013 | -- | $18,222 | $3,500 | $14,722 |
Source: Public Records
Map
Nearby Homes
- 4509 Sims St
- 4516 Sims St
- 349 Art Ave
- 4525 Sentry St
- 4422 Pate Dr
- 59 Apollo Dr
- 4437 St Marys Rd
- 4801 Allen St
- 5003 Shirley Ann Dr
- 5021 Shirley Ann Dr
- 4936 Brightstar Ln
- 538 Lakefront Dr
- 391 & 401 Victoria Dr
- 392 Olsen Ave
- 417 Wickham Dr
- 410 McCartha Dr
- 31 R C Allen Dr
- 441 Braselman Ave
- 4408 Ridgefield Dr
- 4422 Debolt Ct
- 4713 Sentry St
- 161 Wickham Dr
- 167 Wickham Dr
- 136 Wayside Ave
- 153 Wickham Dr
- 173 Wickham Dr
- 4716 Sentry St
- 4550 Sentry St
- 144 Wayside Ave
- 4710 Sentry St
- 147 Wickham Dr
- 4704 Sentry St
- 160 Wickham Dr
- 164 Wickham Dr
- 185 Wickham Dr
- 170 Wickham Dr
- 154 Wayside Ave
- 154 Wickham Dr
- 4549 Sims St
- 176 Wickham Dr
Your Personal Tour Guide
Ask me questions while you tour the home.