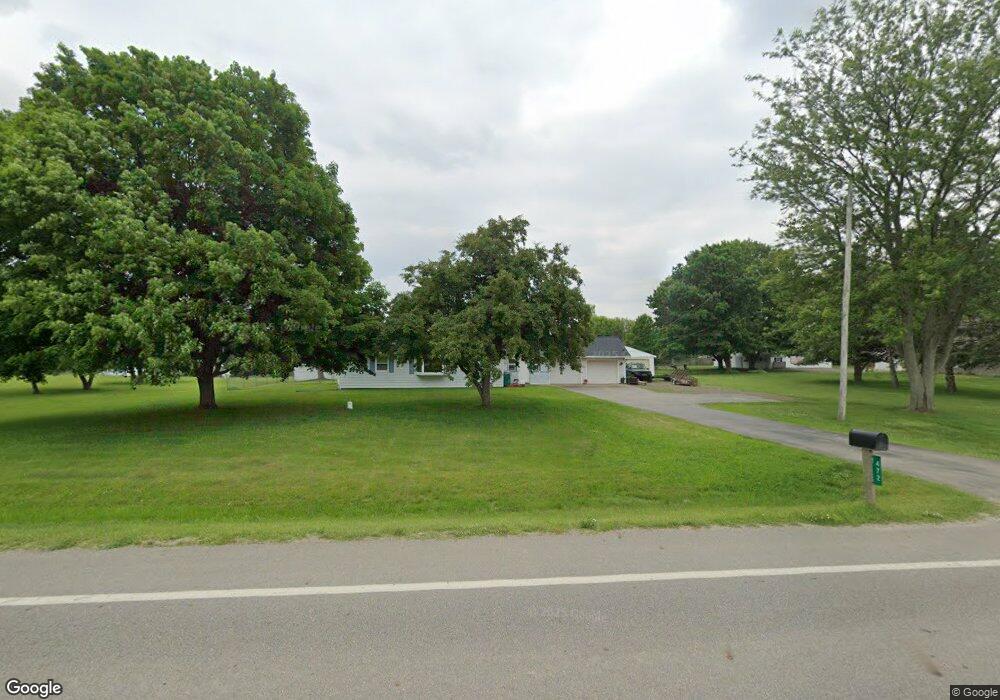
472 135th Ave Wayland, MI 49348
Estimated Value: $326,513 - $369,000
--
Bed
1
Bath
1,628
Sq Ft
$212/Sq Ft
Est. Value
About This Home
This home is located at 472 135th Ave, Wayland, MI 49348 and is currently estimated at $345,128, approximately $211 per square foot. 472 135th Ave is a home located in Allegan County with nearby schools including Wayland High School and St. Therese Catholic School.
Ownership History
Date
Name
Owned For
Owner Type
Purchase Details
Closed on
May 1, 2021
Sold by
Frost Elaine
Bought by
Uminn Kaitlyn and Steffen Javed
Current Estimated Value
Purchase Details
Closed on
Oct 29, 2019
Sold by
Staley Jerry E
Bought by
B & E Frost Llc
Purchase Details
Closed on
Oct 2, 2017
Sold by
Staley Jerry E and Staley Patrick K
Bought by
Staley Jerry E and The Jerry E Staley Trust
Create a Home Valuation Report for This Property
The Home Valuation Report is an in-depth analysis detailing your home's value as well as a comparison with similar homes in the area
Home Values in the Area
Average Home Value in this Area
Purchase History
| Date | Buyer | Sale Price | Title Company |
|---|---|---|---|
| Uminn Kaitlyn | -- | None Available | |
| B & E Frost Llc | $200,000 | None Available | |
| Staley Jerry E | -- | None Available |
Source: Public Records
Mortgage History
| Date | Status | Borrower | Loan Amount |
|---|---|---|---|
| Closed | Uminn Kaitlyn | $0 |
Source: Public Records
Tax History Compared to Growth
Tax History
| Year | Tax Paid | Tax Assessment Tax Assessment Total Assessment is a certain percentage of the fair market value that is determined by local assessors to be the total taxable value of land and additions on the property. | Land | Improvement |
|---|---|---|---|---|
| 2025 | $3,224 | $145,200 | $29,000 | $116,200 |
| 2024 | $4,559 | $147,200 | $29,000 | $118,200 |
| 2023 | $2,884 | $113,400 | $27,500 | $85,900 |
| 2022 | $3,683 | $96,300 | $15,200 | $81,100 |
| 2021 | $2,565 | $89,700 | $15,200 | $74,500 |
| 2020 | $4,434 | $95,600 | $13,900 | $81,700 |
| 2019 | $1,579 | $77,200 | $13,900 | $63,300 |
| 2018 | $818 | $70,100 | $16,500 | $53,600 |
| 2017 | $0 | $70,800 | $16,500 | $54,300 |
| 2016 | $0 | $58,700 | $15,900 | $42,800 |
| 2015 | -- | $58,700 | $15,900 | $42,800 |
| 2014 | -- | $55,900 | $16,800 | $39,100 |
| 2013 | -- | $51,400 | $16,800 | $34,600 |
Source: Public Records
Map
Nearby Homes
- 619 137th Ave
- 3214 7th St
- 843 Wild Flower Ct
- 835 Wild Flower Ct
- 516 131st Ave
- 3296 Stonehill Ct
- 330 Lotz Ct
- 3282 Stonehill Ct
- 401 Anderson Dr
- 12857 Michael Dr Unit 49
- 3905 Sunset View
- 12720 S Grey Ct
- 146 Hanlon Ct
- 212 E Superior St
- 1391 Shadowridge Dr
- 110 E Sycamore St
- 1164 E Bernie Ct
- 545 N Main St
- 4007 2nd St
- 3770 Division Ave S
- 476 135th Ave
- 476 135th Ave Unit A
- 460 135th Ave
- 3477 5th St
- 495 135th Ave
- 486 135th Ave
- 446 135th Ave
- 3489 5th St
- 3471 5th St
- 447 135th Ave
- 3453 5th St
- 424 135th Ave
- 518 135th Ave
- 435 Hill Lake Rd
- 435 135th Ave
- 434 Hill Lake Rd
- 423 135th Ave
- 425 Hill Lake Rd
- 425 Hill Lake Rd
- 3445 Breanas Way Dr Unit 6