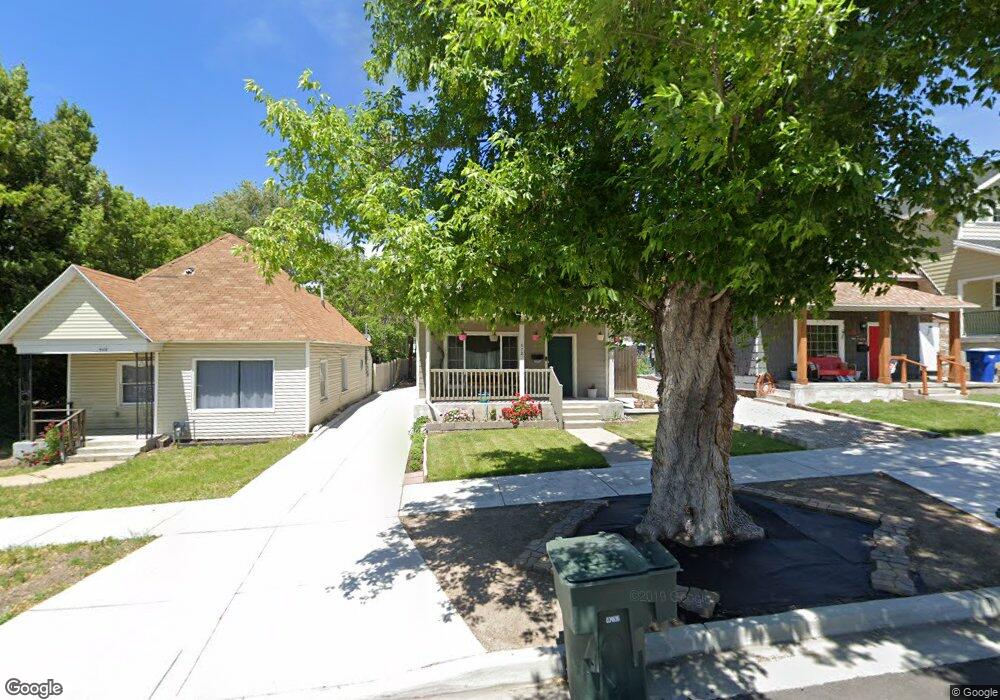
472 21st St Ogden, UT 84401
Downtown Ogden NeighborhoodEstimated Value: $291,663 - $334,000
3
Beds
1
Bath
1,020
Sq Ft
$313/Sq Ft
Est. Value
About This Home
This home is located at 472 21st St, Ogden, UT 84401 and is currently estimated at $319,666, approximately $313 per square foot. 472 21st St is a home located in Weber County with nearby schools including New Bridge School, Mound Fort Junior High School, and Ogden High School.
Ownership History
Date
Name
Owned For
Owner Type
Purchase Details
Closed on
Aug 23, 2022
Sold by
Jones Margaret
Bought by
Margaret Jones Living Trust
Current Estimated Value
Purchase Details
Closed on
Jan 9, 2017
Sold by
Ogden City Corporation
Bought by
Jones Margaret
Home Financials for this Owner
Home Financials are based on the most recent Mortgage that was taken out on this home.
Original Mortgage
$127,645
Interest Rate
4.08%
Mortgage Type
FHA
Purchase Details
Closed on
Oct 28, 2010
Sold by
Johnson Jeremiah and Phalen Joseph
Bought by
Condemarin Janett Y
Home Financials for this Owner
Home Financials are based on the most recent Mortgage that was taken out on this home.
Original Mortgage
$92,750
Interest Rate
4.33%
Mortgage Type
FHA
Purchase Details
Closed on
Jul 13, 2010
Sold by
Winters Shellie H and Struble Shellie
Bought by
Johnson Jeremiah and Phalen Joseph
Create a Home Valuation Report for This Property
The Home Valuation Report is an in-depth analysis detailing your home's value as well as a comparison with similar homes in the area
Home Values in the Area
Average Home Value in this Area
Purchase History
| Date | Buyer | Sale Price | Title Company |
|---|---|---|---|
| Margaret Jones Living Trust | -- | -- | |
| Jones Margaret | -- | Stewart Title Ins Agency | |
| Condemarin Janett Y | -- | Inwest Title Ogden | |
| Johnson Jeremiah | -- | Inwest Title Ogden |
Source: Public Records
Mortgage History
| Date | Status | Borrower | Loan Amount |
|---|---|---|---|
| Previous Owner | Jones Margaret | $127,645 | |
| Previous Owner | Condemarin Janett Y | $92,750 |
Source: Public Records
Tax History
| Year | Tax Paid | Tax Assessment Tax Assessment Total Assessment is a certain percentage of the fair market value that is determined by local assessors to be the total taxable value of land and additions on the property. | Land | Improvement |
|---|---|---|---|---|
| 2025 | $1,872 | $274,444 | $91,477 | $182,967 |
| 2024 | $1,924 | $276,999 | $91,354 | $185,645 |
| 2023 | $1,698 | $245,999 | $84,245 | $161,754 |
| 2022 | $1,893 | $274,999 | $79,536 | $195,463 |
| 2021 | $1,576 | $209,000 | $40,291 | $168,709 |
| 2020 | $1,306 | $160,000 | $31,160 | $128,840 |
| 2019 | $1,235 | $142,000 | $26,259 | $115,741 |
| 2018 | $1,076 | $123,000 | $21,232 | $101,768 |
| 2017 | $1,068 | $114,000 | $29,349 | $84,651 |
Source: Public Records
Map
Nearby Homes
- 2168 Adams Ave
- 2218 Adams Ave
- 2255 Ogden Ave
- 622 E 21st St
- 1987 Birch Cove St
- 1612 S 4350 W Unit 215
- 1275 S 985 E
- 2057 S 4520 W
- 1279 S 985 E
- 2166 S 4520 W
- 1271 S 985 E
- 536 E 2360 S
- 658 23rd St Unit 1
- 660 23rd St
- 2003 Liberty Ave
- 4145 W 1575 S Unit 116
- 4119 W 1575 S Unit 117
- 4159 W 1575 S Unit 115
- 705 23rd St
- 815 E 22nd St
Your Personal Tour Guide
Ask me questions while you tour the home.