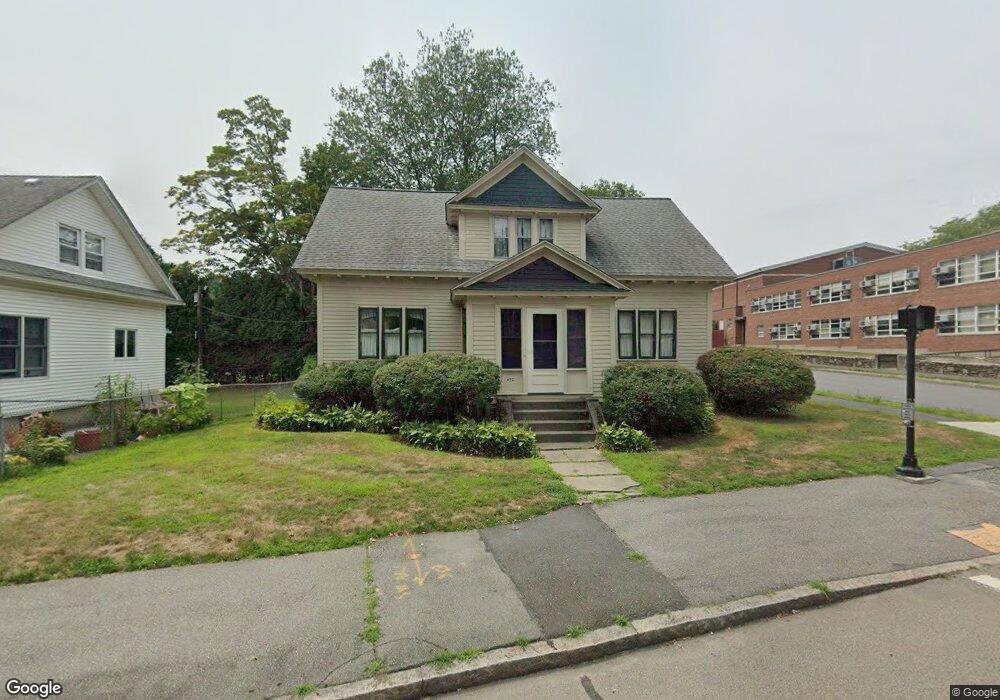
472 Chandler St Worcester, MA 01602
Newton Square NeighborhoodEstimated Value: $463,000 - $494,000
3
Beds
2
Baths
1,700
Sq Ft
$278/Sq Ft
Est. Value
About This Home
This home is located at 472 Chandler St, Worcester, MA 01602 and is currently estimated at $473,373, approximately $278 per square foot. 472 Chandler St is a home located in Worcester County with nearby schools including Chandler Magnet, Jacob Hiatt Magnet School, and May Street Elementary School.
Ownership History
Date
Name
Owned For
Owner Type
Purchase Details
Closed on
Apr 3, 1996
Sold by
Barboni Jeanne A
Bought by
Tanona Mary
Current Estimated Value
Home Financials for this Owner
Home Financials are based on the most recent Mortgage that was taken out on this home.
Original Mortgage
$90,800
Interest Rate
7.31%
Mortgage Type
Purchase Money Mortgage
Purchase Details
Closed on
Jun 12, 1992
Sold by
Chapel Point Assoc Tr
Bought by
Barboni Jeanne A
Home Financials for this Owner
Home Financials are based on the most recent Mortgage that was taken out on this home.
Original Mortgage
$91,000
Interest Rate
8.79%
Mortgage Type
Purchase Money Mortgage
Purchase Details
Closed on
Dec 16, 1991
Sold by
Dunn John J
Bought by
Chapel Point Assoc
Create a Home Valuation Report for This Property
The Home Valuation Report is an in-depth analysis detailing your home's value as well as a comparison with similar homes in the area
Home Values in the Area
Average Home Value in this Area
Purchase History
| Date | Buyer | Sale Price | Title Company |
|---|---|---|---|
| Tanona Mary | $113,500 | -- | |
| Barboni Jeanne A | $96,500 | -- | |
| Chapel Point Assoc | $70,000 | -- |
Source: Public Records
Mortgage History
| Date | Status | Borrower | Loan Amount |
|---|---|---|---|
| Open | Chapel Point Assoc | $69,500 | |
| Closed | Chapel Point Assoc | $90,800 | |
| Previous Owner | Chapel Point Assoc | $91,000 | |
| Previous Owner | Chapel Point Assoc | $91,000 |
Source: Public Records
Tax History Compared to Growth
Tax History
| Year | Tax Paid | Tax Assessment Tax Assessment Total Assessment is a certain percentage of the fair market value that is determined by local assessors to be the total taxable value of land and additions on the property. | Land | Improvement |
|---|---|---|---|---|
| 2025 | $5,250 | $398,000 | $112,500 | $285,500 |
| 2024 | $5,121 | $372,400 | $112,500 | $259,900 |
| 2023 | $4,934 | $344,100 | $97,800 | $246,300 |
| 2022 | $4,523 | $297,400 | $78,300 | $219,100 |
| 2021 | $4,482 | $275,300 | $62,600 | $212,700 |
| 2020 | $4,372 | $257,200 | $62,600 | $194,600 |
| 2019 | $4,126 | $229,200 | $56,300 | $172,900 |
| 2018 | $4,102 | $216,900 | $56,300 | $160,600 |
| 2017 | $3,954 | $205,700 | $56,300 | $149,400 |
| 2016 | $3,982 | $193,200 | $41,800 | $151,400 |
| 2015 | $3,878 | $193,200 | $41,800 | $151,400 |
| 2014 | $3,775 | $193,200 | $41,800 | $151,400 |
Source: Public Records
Map
Nearby Homes
- 250 May St
- 18 Zenith Dr
- 16 Sherwood Rd
- 2 Carlisle St
- 96 June St Unit 3
- 41 Walnut Hill Dr
- 53 Howland Terrace
- 40 Howland Terrace
- 371 Chandler St Unit 2
- 71 Glendale St
- 346 Lovell St
- 563 Chandler St
- 19 Kenilworth Rd
- 83 Commodore Rd
- 9 Field Way
- 20 Manhattan Rd
- 47R Yarnie Unit 3B
- 47R Yarnie Unit 3A
- 47R Yarnie Unit 1B
- 47R Yarnie Unit 2B