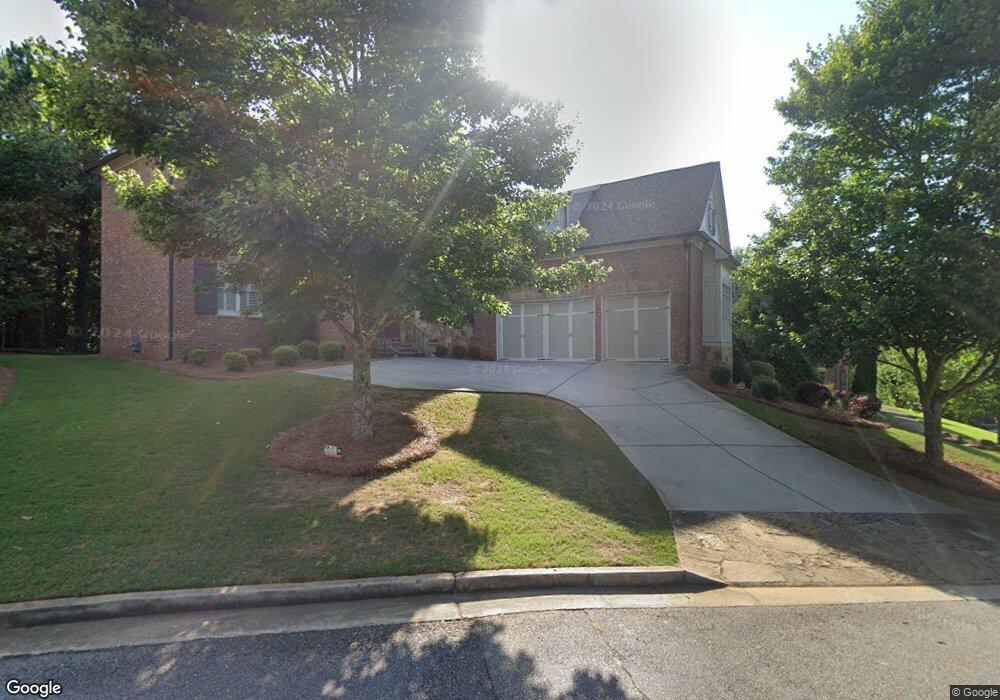
4720 Cambridge Approach Cir NE Unit 10 Roswell, GA 30075
Southeast Cobb NeighborhoodEstimated Value: $1,148,000 - $1,277,000
5
Beds
6
Baths
4,792
Sq Ft
$257/Sq Ft
Est. Value
About This Home
This home is located at 4720 Cambridge Approach Cir NE Unit 10, Roswell, GA 30075 and is currently estimated at $1,229,458, approximately $256 per square foot. 4720 Cambridge Approach Cir NE Unit 10 is a home located in Cobb County with nearby schools including Tritt Elementary School, Hightower Trail Middle School, and Pope High School.
Ownership History
Date
Name
Owned For
Owner Type
Purchase Details
Closed on
Jun 15, 2020
Sold by
Kaufman Samuel and Kaufman Jennifer
Bought by
Hopkins Jon and Lantrip Kristari Nikole
Current Estimated Value
Home Financials for this Owner
Home Financials are based on the most recent Mortgage that was taken out on this home.
Original Mortgage
$450,000
Outstanding Balance
$398,008
Interest Rate
3.2%
Mortgage Type
New Conventional
Estimated Equity
$831,450
Purchase Details
Closed on
Nov 14, 2016
Sold by
Ferro Building Co Llc
Bought by
Kaufman Samuel and Kaufman Jennifer
Home Financials for this Owner
Home Financials are based on the most recent Mortgage that was taken out on this home.
Original Mortgage
$670,050
Interest Rate
4.5%
Mortgage Type
New Conventional
Purchase Details
Closed on
Dec 2, 2015
Sold by
Koenig Robert
Bought by
Ferro Building Co Llc
Create a Home Valuation Report for This Property
The Home Valuation Report is an in-depth analysis detailing your home's value as well as a comparison with similar homes in the area
Home Values in the Area
Average Home Value in this Area
Purchase History
| Date | Buyer | Sale Price | Title Company |
|---|---|---|---|
| Hopkins Jon | $750,000 | None Available | |
| Kaufman Samuel | $744,500 | -- | |
| Ferro Building Co Llc | $160,000 | -- |
Source: Public Records
Mortgage History
| Date | Status | Borrower | Loan Amount |
|---|---|---|---|
| Open | Hopkins Jon | $450,000 | |
| Previous Owner | Kaufman Samuel | $670,050 |
Source: Public Records
Tax History Compared to Growth
Tax History
| Year | Tax Paid | Tax Assessment Tax Assessment Total Assessment is a certain percentage of the fair market value that is determined by local assessors to be the total taxable value of land and additions on the property. | Land | Improvement |
|---|---|---|---|---|
| 2025 | $13,685 | $526,952 | $120,000 | $406,952 |
| 2024 | $11,711 | $435,424 | $88,000 | $347,424 |
| 2023 | $10,312 | $395,956 | $88,000 | $307,956 |
| 2022 | $8,831 | $300,000 | $72,120 | $227,880 |
| 2021 | $9,105 | $300,000 | $72,120 | $227,880 |
| 2020 | $9,337 | $307,656 | $74,000 | $233,656 |
| 2019 | $8,900 | $293,240 | $74,000 | $219,240 |
| 2018 | $8,900 | $293,240 | $74,000 | $219,240 |
| 2017 | $8,431 | $293,240 | $74,000 | $219,240 |
| 2016 | $863 | $30,000 | $30,000 | $0 |
| 2015 | $884 | $30,000 | $30,000 | $0 |
| 2014 | $891 | $30,000 | $0 | $0 |
Source: Public Records
Map
Nearby Homes
- 4680 Cambridge Approach Cir NE
- 3393 Childers Rd NE
- 3616 Hampstead Ln NE
- 4645 Shallowford Rd
- 3333 Trails End Rd NE
- 3402 Johnson Ferry Rd NE
- 4618 Shallowford Rd
- 4509 Bastion Dr
- 1533 Tennessee Walker Dr NE
- 4505 Bastion Dr
- 3865 Mabry Rd NE
- 3760 Loch Highland Pkwy NE
- 1483 Jones Rd
- 2095 Shallowford Park Manor
- 3277 Artessa Ln NE
- 4220 Singing Post Ln NE
- 4486 Huffman Dr NE
- 4720 Cambridge Approach Cir Unit 10
- 4720 Cambridge Approach Cir
- 4710 Cambridge Approach Cir NE
- 4700 Cambridge Approach Cir
- 4700 Cambridge Approach Cir NE
- 4715 Cambridge Approach Cir NE
- 4725 Cambridge Approach Cir NE
- 4725 Cambridge Approach Cir
- 1619 Ellenwood Dr NE
- 1619 Ellenwood Dr NE
- 1625 Ellenwood Dr NE
- 3470 Ellenwood Park Dr NE
- 4705 Cambridge Approach Cir NE
- 3497 Johnson Ferry Rd NE
- 3499 Johnson Ferry Rd NE
- 0 Ellenwood Dr NE Unit 7442889
- 0 Ellenwood Dr NE Unit 8501459
- 0 Ellenwood Dr NE Unit 8254005
- 0 Ellenwood Dr NE Unit 8069308
- 0 Ellenwood Dr NE Unit 7613506