Estimated Value: $132,000 - $189,000
2
Beds
1
Bath
1,325
Sq Ft
$125/Sq Ft
Est. Value
About This Home
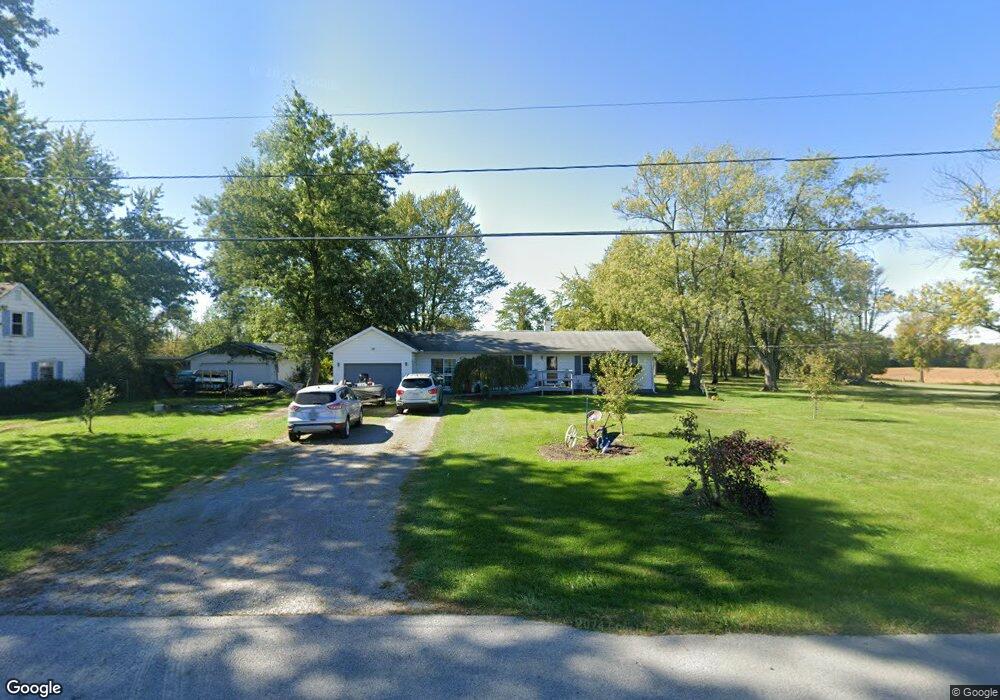
This home is located at 4720 Delong Rd, Lima, OH 45806 and is currently estimated at $165,937, approximately $125 per square foot. 4720 Delong Rd is a home located in Allen County with nearby schools including Elmwood Elementary School, Maplewood Elementary School, and Shawnee Middle School.
Ownership History
Date
Name
Owned For
Owner Type
Purchase Details
Closed on
Mar 18, 1999
Sold by
Francis Gilbert
Bought by
Alder Michael and Alder Pamela
Current Estimated Value
Home Financials for this Owner
Home Financials are based on the most recent Mortgage that was taken out on this home.
Original Mortgage
$68,875
Outstanding Balance
$16,740
Interest Rate
6.8%
Mortgage Type
New Conventional
Estimated Equity
$149,197
Purchase Details
Closed on
Jul 31, 1996
Sold by
Umble Gloria
Bought by
Francis Gilbert and Francis Topeka
Home Financials for this Owner
Home Financials are based on the most recent Mortgage that was taken out on this home.
Original Mortgage
$62,700
Interest Rate
8.33%
Mortgage Type
New Conventional
Purchase Details
Closed on
May 20, 1994
Sold by
Greynolds James A
Bought by
Umble Gloria J
Purchase Details
Closed on
Jan 1, 1990
Bought by
Greynolds James A
Create a Home Valuation Report for This Property
The Home Valuation Report is an in-depth analysis detailing your home's value as well as a comparison with similar homes in the area
Home Values in the Area
Average Home Value in this Area
Purchase History
| Date | Buyer | Sale Price | Title Company |
|---|---|---|---|
| Alder Michael | $72,500 | -- | |
| Francis Gilbert | $66,000 | -- | |
| Umble Gloria J | $38,000 | -- | |
| Greynolds James A | -- | -- |
Source: Public Records
Mortgage History
| Date | Status | Borrower | Loan Amount |
|---|---|---|---|
| Open | Alder Michael | $68,875 | |
| Previous Owner | Francis Gilbert | $62,700 |
Source: Public Records
Tax History Compared to Growth
Tax History
| Year | Tax Paid | Tax Assessment Tax Assessment Total Assessment is a certain percentage of the fair market value that is determined by local assessors to be the total taxable value of land and additions on the property. | Land | Improvement |
|---|---|---|---|---|
| 2024 | $2,273 | $45,290 | $11,060 | $34,230 |
| 2023 | $1,999 | $34,830 | $8,510 | $26,320 |
| 2022 | $1,993 | $34,830 | $8,510 | $26,320 |
| 2021 | $2,002 | $34,830 | $8,510 | $26,320 |
| 2020 | $1,538 | $30,730 | $8,330 | $22,400 |
| 2019 | $1,538 | $30,730 | $8,330 | $22,400 |
| 2018 | $1,544 | $30,730 | $8,330 | $22,400 |
| 2017 | $1,579 | $30,730 | $8,330 | $22,400 |
| 2016 | $1,571 | $30,730 | $8,330 | $22,400 |
| 2015 | $1,512 | $30,730 | $8,330 | $22,400 |
| 2014 | $1,512 | $29,480 | $8,230 | $21,250 |
| 2013 | $1,484 | $29,480 | $8,230 | $21,250 |
Source: Public Records
Map
Nearby Homes
- 301 Muskingum Trail
- 1805 Huntington Dr
- 1835 Huntington Dr
- 1643 W Breese Rd Unit 73
- 5290 New Haven Dr
- 17946 National Rd
- 1934 Jo Jean Rd
- 212 S Oak St
- 2613 Jonathon Dr
- 2691 Jonathan Dr
- 2638 Summer Rambo Ct
- 2648 Summer Rambo Ct
- 137 Caribou Cir
- 306 Shawnee Rd
- 3780 Shawnee Rd
- 3828 Saint Johns Rd
- 3744 Linfield Ln
- 3549 Camden Place
- 3372 Weldon Dr
- 3346 Weldon Dr