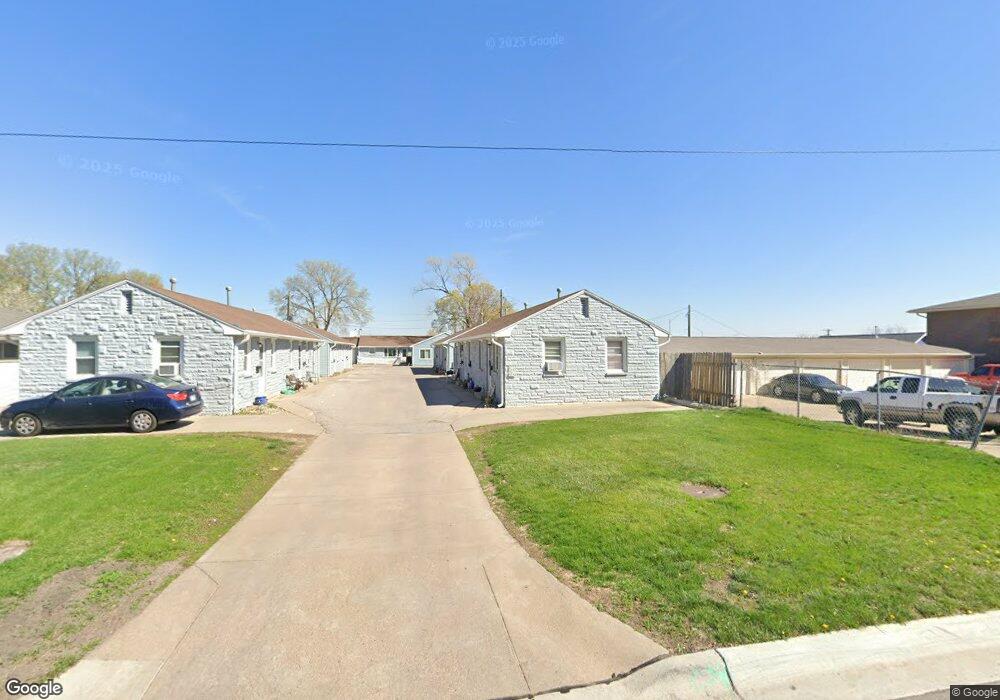
4720 M St Lincoln, NE 68510
Witherbee NeighborhoodEstimated Value: $587,967 - $647,000
19
Beds
10
Baths
5,996
Sq Ft
$103/Sq Ft
Est. Value
About This Home
This home is located at 4720 M St, Lincoln, NE 68510 and is currently estimated at $617,484, approximately $102 per square foot. 4720 M St is a home located in Lancaster County with nearby schools including Randolph Elementary School, Lefler Middle School, and Lincoln East High School.
Ownership History
Date
Name
Owned For
Owner Type
Purchase Details
Closed on
Aug 8, 2013
Sold by
Luu Chi V and Luu Adi R
Bought by
328 Property Management Llc
Current Estimated Value
Purchase Details
Closed on
Nov 29, 2012
Sold by
Lpgsdon Delores M
Bought by
Luu Chi and Luu Adi R
Home Financials for this Owner
Home Financials are based on the most recent Mortgage that was taken out on this home.
Original Mortgage
$210,000
Interest Rate
3.42%
Mortgage Type
Future Advance Clause Open End Mortgage
Create a Home Valuation Report for This Property
The Home Valuation Report is an in-depth analysis detailing your home's value as well as a comparison with similar homes in the area
Home Values in the Area
Average Home Value in this Area
Purchase History
| Date | Buyer | Sale Price | Title Company |
|---|---|---|---|
| 328 Property Management Llc | -- | Union Title Company Llc | |
| Luu Chi | $285,000 | Charter Title & Escrow Servi | |
| Logsdon Delores M | -- | None Available |
Source: Public Records
Mortgage History
| Date | Status | Borrower | Loan Amount |
|---|---|---|---|
| Previous Owner | Luu Chi | $210,000 |
Source: Public Records
Tax History Compared to Growth
Tax History
| Year | Tax Paid | Tax Assessment Tax Assessment Total Assessment is a certain percentage of the fair market value that is determined by local assessors to be the total taxable value of land and additions on the property. | Land | Improvement |
|---|---|---|---|---|
| 2025 | $7,899 | $594,500 | $70,000 | $524,500 |
| 2024 | $7,899 | $566,400 | $70,000 | $496,400 |
| 2023 | $9,045 | $539,700 | $70,000 | $469,700 |
| 2022 | $9,519 | $477,600 | $70,000 | $407,600 |
| 2021 | $8,004 | $424,500 | $70,000 | $354,500 |
| 2020 | $6,080 | $318,200 | $70,000 | $248,200 |
| 2019 | $6,081 | $318,200 | $70,000 | $248,200 |
| 2018 | $6,108 | $318,200 | $70,000 | $248,200 |
| 2017 | $5,742 | $296,400 | $70,000 | $226,400 |
| 2016 | $5,771 | $296,400 | $70,000 | $226,400 |
| 2015 | $5,732 | $296,400 | $70,000 | $226,400 |
| 2014 | $6,185 | $318,000 | $70,000 | $248,000 |
| 2013 | -- | $318,000 | $70,000 | $248,000 |
Source: Public Records
Map
Nearby Homes