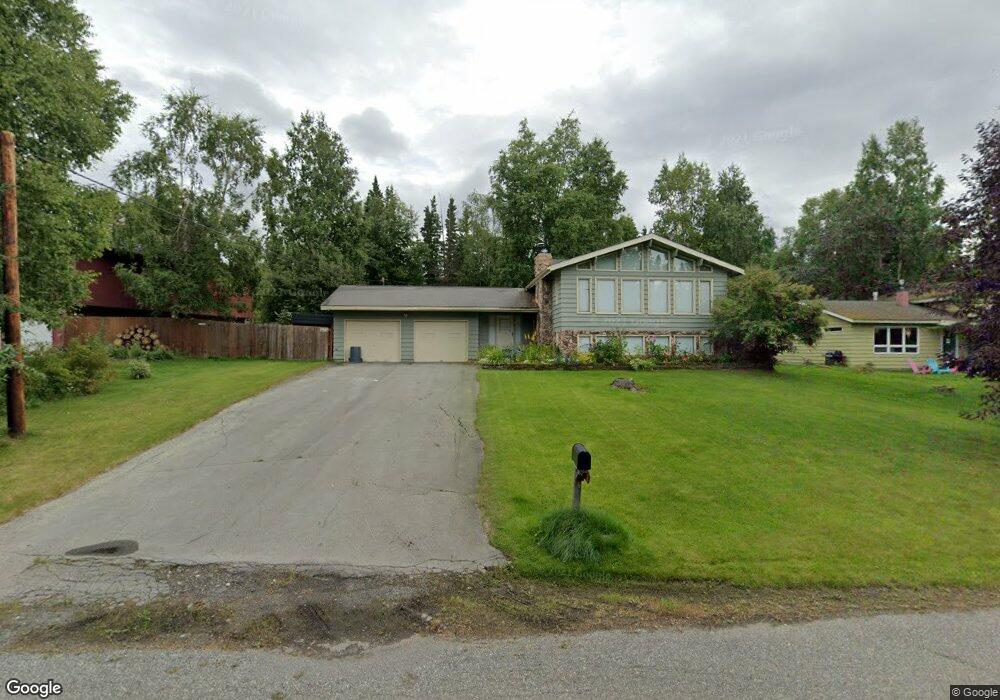
4720 Mars Dr Anchorage, AK 99507
Abbott Loop NeighborhoodEstimated Value: $485,000 - $623,000
4
Beds
3
Baths
2,130
Sq Ft
$259/Sq Ft
Est. Value
About This Home
This home is located at 4720 Mars Dr, Anchorage, AK 99507 and is currently estimated at $551,177, approximately $258 per square foot. 4720 Mars Dr is a home located in Anchorage Municipality with nearby schools including Trailside Elementary, Hanshew Middle School, and Service High School.
Ownership History
Date
Name
Owned For
Owner Type
Purchase Details
Closed on
Jul 30, 2002
Sold by
Delbert Anthony L
Bought by
Fahrenbrook Todd R
Current Estimated Value
Home Financials for this Owner
Home Financials are based on the most recent Mortgage that was taken out on this home.
Original Mortgage
$107,000
Interest Rate
6.6%
Purchase Details
Closed on
May 29, 1997
Sold by
Miles Benjamin F and Miles Karen L
Bought by
Delbert Anthony L
Home Financials for this Owner
Home Financials are based on the most recent Mortgage that was taken out on this home.
Original Mortgage
$167,914
Interest Rate
8.13%
Mortgage Type
FHA
Create a Home Valuation Report for This Property
The Home Valuation Report is an in-depth analysis detailing your home's value as well as a comparison with similar homes in the area
Home Values in the Area
Average Home Value in this Area
Purchase History
| Date | Buyer | Sale Price | Title Company |
|---|---|---|---|
| Fahrenbrook Todd R | -- | -- | |
| Delbert Anthony L | -- | -- |
Source: Public Records
Mortgage History
| Date | Status | Borrower | Loan Amount |
|---|---|---|---|
| Closed | Fahrenbrook Todd R | $107,000 | |
| Previous Owner | Delbert Anthony L | $167,914 |
Source: Public Records
Tax History
| Year | Tax Paid | Tax Assessment Tax Assessment Total Assessment is a certain percentage of the fair market value that is determined by local assessors to be the total taxable value of land and additions on the property. | Land | Improvement |
|---|---|---|---|---|
| 2025 | $5,641 | $455,500 | $108,400 | $347,100 |
| 2024 | $5,641 | $424,400 | $108,400 | $316,000 |
| 2023 | $6,717 | $394,400 | $108,400 | $286,000 |
| 2022 | $5,396 | $370,400 | $108,400 | $262,000 |
| 2021 | $6,314 | $350,400 | $108,400 | $242,000 |
| 2020 | $5,002 | $344,500 | $108,400 | $236,100 |
| 2019 | $4,748 | $340,200 | $108,400 | $231,800 |
| 2018 | $4,669 | $334,700 | $108,400 | $226,300 |
| 2017 | $5,155 | $349,200 | $102,600 | $246,600 |
| 2016 | $4,442 | $346,500 | $102,600 | $243,900 |
| 2015 | $4,442 | $330,300 | $103,000 | $227,300 |
| 2014 | $4,442 | $318,500 | $89,200 | $229,300 |
Source: Public Records
Map
Nearby Homes
- 4738 Egret Rock Cir
- 9400 Spring Hill Dr
- 000 Valley View Dr
- Lt 87 Carlson Rd
- L82 Carlson Rd
- 9191 Chapelle Cir
- 5300 Shaun Cir
- 8401 Stacey Cir
- 6130 Summit St
- 3929 Iona Cir
- 112 Chelsea St
- 8261 Stratton Cir
- 8131 Medellin Cir
- 8020 Sabrina St
- 6640 O'Malley Rd
- 2900 Sun Spot Cir
- 6324 Red Tree Cir
- 3030 Lore Rd Unit B1
- 8152 Marsha Loop Unit 8152
- 0 Rd
Your Personal Tour Guide
Ask me questions while you tour the home.