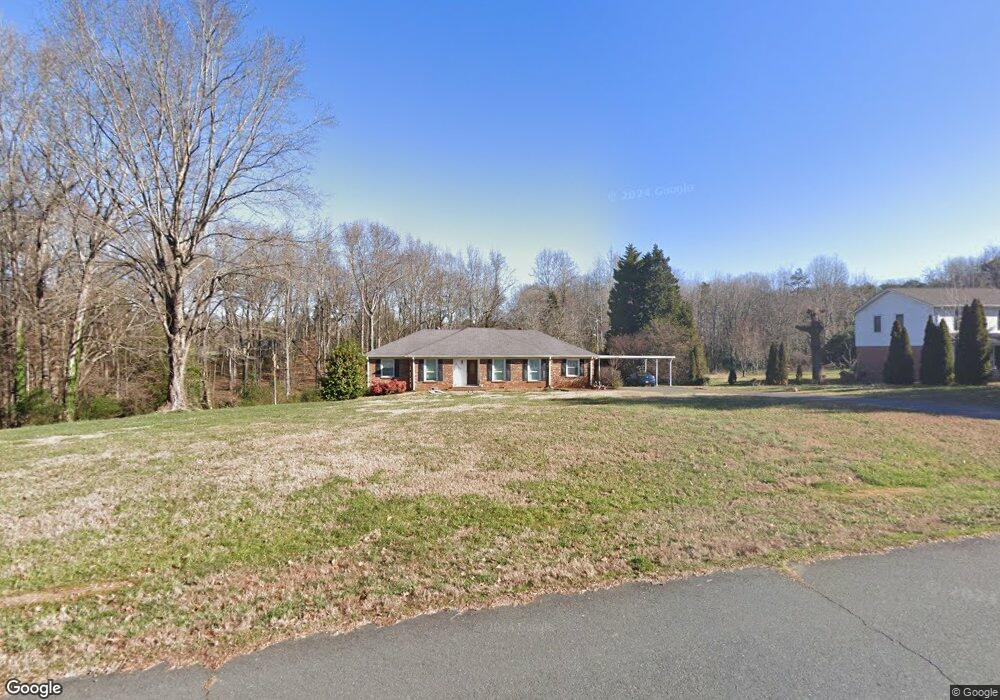
4720 Pine Needle Trail Mint Hill, NC 28227
Estimated Value: $381,751 - $493,000
3
Beds
2
Baths
1,794
Sq Ft
$242/Sq Ft
Est. Value
About This Home
This home is located at 4720 Pine Needle Trail, Mint Hill, NC 28227 and is currently estimated at $433,688, approximately $241 per square foot. 4720 Pine Needle Trail is a home located in Mecklenburg County with nearby schools including Bain Elementary, Mint Hill Middle School, and Independence High.
Ownership History
Date
Name
Owned For
Owner Type
Purchase Details
Closed on
Dec 5, 2022
Sold by
Kuvila Nikolay D and Kuvila Daniel
Bought by
Kuvila Daniel Nikolayeevic
Current Estimated Value
Purchase Details
Closed on
Oct 24, 2013
Sold by
Fedeal Home Loan Mortgage Corp
Bought by
Kuvila Kikolay D and Kuvila Daniil
Home Financials for this Owner
Home Financials are based on the most recent Mortgage that was taken out on this home.
Original Mortgage
$154,660
Interest Rate
4.13%
Mortgage Type
FHA
Purchase Details
Closed on
Jun 24, 2013
Sold by
Mcphail Michael J and Mcphail Sherrie G
Bought by
Federal Home Loan Mortgage Corporation
Purchase Details
Closed on
Sep 26, 2003
Sold by
Bradley James A and Bradley Teresa C
Bought by
Mcphail Michael J and Mcphail Sherrie G
Home Financials for this Owner
Home Financials are based on the most recent Mortgage that was taken out on this home.
Original Mortgage
$163,900
Interest Rate
6.24%
Mortgage Type
Purchase Money Mortgage
Create a Home Valuation Report for This Property
The Home Valuation Report is an in-depth analysis detailing your home's value as well as a comparison with similar homes in the area
Home Values in the Area
Average Home Value in this Area
Purchase History
| Date | Buyer | Sale Price | Title Company |
|---|---|---|---|
| Kuvila Daniel Nikolayeevic | -- | -- | |
| Kuvila Kikolay D | -- | None Available | |
| Federal Home Loan Mortgage Corporation | -- | None Available | |
| Mcphail Michael J | $169,000 | -- |
Source: Public Records
Mortgage History
| Date | Status | Borrower | Loan Amount |
|---|---|---|---|
| Previous Owner | Kuvila Kikolay D | $154,660 | |
| Previous Owner | Mcphail Michael J | $163,900 |
Source: Public Records
Tax History
| Year | Tax Paid | Tax Assessment Tax Assessment Total Assessment is a certain percentage of the fair market value that is determined by local assessors to be the total taxable value of land and additions on the property. | Land | Improvement |
|---|---|---|---|---|
| 2025 | -- | $341,300 | $94,500 | $246,800 |
| 2024 | -- | $341,300 | $94,500 | $246,800 |
| 2023 | $1,855 | $341,300 | $94,500 | $246,800 |
| 2022 | $1,855 | $212,800 | $60,000 | $152,800 |
| 2021 | $1,895 | $212,800 | $60,000 | $152,800 |
| 2020 | $1,895 | $212,800 | $60,000 | $152,800 |
| 2019 | $1,889 | $212,800 | $60,000 | $152,800 |
| 2018 | $1,723 | $155,100 | $36,000 | $119,100 |
| 2017 | $1,708 | $155,100 | $36,000 | $119,100 |
| 2016 | $1,704 | $155,100 | $36,000 | $119,100 |
| 2015 | $1,701 | $155,100 | $36,000 | $119,100 |
| 2014 | $1,699 | $155,100 | $36,000 | $119,100 |
Source: Public Records
Map
Nearby Homes
- 5332 Quail Ridge Dr
- 10305 Misty Moss Ct
- 5500 Beaver Dam Ln
- 4116 Hoodridge Ln
- 6521 Old Magnolia Ln
- 6565 Robin Hollow Dr
- 8237 Franklin Trail St
- 8233 Franklin Trail St
- 8209 Franklin Trail St
- 8234 Franklin Trail St
- 8137 Franklin Trail St
- 4123 Roe Creek Dr
- 4119 Roe Creek Dr
- 7220 Timber Ridge Dr
- 6705 Old Magnolia Ln
- 5900 Foxcrest Dr
- 10116 Mountain Apple Dr
- 6270 Hove Rd
- 4027 Mintwood Dr
- 10830 Kempton Square N
- 4710 Pine Needle Trail
- 4818 Pine Needle Trail
- 4715 Pine Needle Trail
- 4700 Pine Needle Trail
- 4801 Pine Needle Trail
- 4618 Carving Tree Dr
- 4811 Pine Needle Trail
- 4700 Carving Tree Dr
- 6321 Windy Knoll Ln
- 4821 Pine Needle Trail
- 4824 Pine Needle Trail
- 4710 Carving Tree Dr
- 4610 Carving Tree Dr
- 6209 Windy Knoll Ln
- 4720 Carving Tree Dr
- 4827 Pine Needle Trail
- 6329 Windy Knoll Ln
- 4654 Pine Needle Trail
- 4722 Squirrel Nest Ln
- 6201 Windy Knoll Ln
Your Personal Tour Guide
Ask me questions while you tour the home.