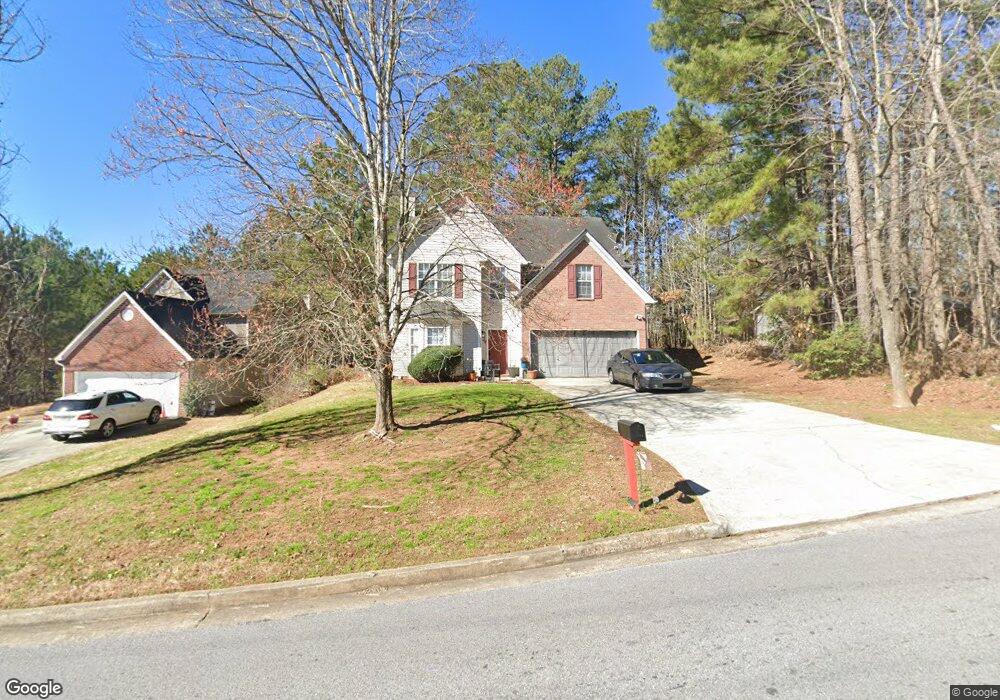
4721 Browns Mill Ferry Rd Lithonia, GA 30038
Estimated Value: $211,000 - $270,000
4
Beds
3
Baths
1,950
Sq Ft
$127/Sq Ft
Est. Value
About This Home
This home is located at 4721 Browns Mill Ferry Rd, Lithonia, GA 30038 and is currently estimated at $247,638, approximately $126 per square foot. 4721 Browns Mill Ferry Rd is a home located in DeKalb County with nearby schools including Murphy Candler Elementary School, Salem Middle School, and Martin Luther King- Jr. High School.
Ownership History
Date
Name
Owned For
Owner Type
Purchase Details
Closed on
Nov 1, 2018
Sold by
Browns Mill Ferry 4721 Trust
Bought by
Housing Jubilee Tr
Current Estimated Value
Purchase Details
Closed on
Sep 17, 2008
Sold by
Citigroup Mtg Ln Trust 2006-He
Bought by
Browns Mill Ferry 4721 Trust
Purchase Details
Closed on
May 6, 2008
Sold by
Wimberly Shamonia
Bought by
Citigroup Mtg Ln Trust 2006-He
Purchase Details
Closed on
Dec 6, 2005
Sold by
Washington Mutual Bk
Bought by
Secretary Of Hud
Purchase Details
Closed on
Sep 28, 2001
Sold by
Oleviria Kevin J and Oleviria Rosemary A
Bought by
Oleviria Kevin J and Oleviria Rosemary A
Home Financials for this Owner
Home Financials are based on the most recent Mortgage that was taken out on this home.
Original Mortgage
$141,696
Interest Rate
6.67%
Mortgage Type
FHA
Create a Home Valuation Report for This Property
The Home Valuation Report is an in-depth analysis detailing your home's value as well as a comparison with similar homes in the area
Home Values in the Area
Average Home Value in this Area
Purchase History
| Date | Buyer | Sale Price | Title Company |
|---|---|---|---|
| Housing Jubilee Tr | -- | -- | |
| Browns Mill Ferry 4721 Trust | $79,000 | -- | |
| Citigroup Mtg Ln Trust 2006-He | $87,200 | -- | |
| Secretary Of Hud | -- | -- | |
| Washington Mutual Bk | $161,810 | -- | |
| Oleviria Kevin J | -- | -- | |
| Oleviria Kevin J | $144,000 | -- |
Source: Public Records
Mortgage History
| Date | Status | Borrower | Loan Amount |
|---|---|---|---|
| Previous Owner | Oleviria Kevin J | $141,696 |
Source: Public Records
Tax History Compared to Growth
Tax History
| Year | Tax Paid | Tax Assessment Tax Assessment Total Assessment is a certain percentage of the fair market value that is determined by local assessors to be the total taxable value of land and additions on the property. | Land | Improvement |
|---|---|---|---|---|
| 2025 | $5,275 | $107,400 | $18,000 | $89,400 |
| 2024 | $5,207 | $106,640 | $18,000 | $88,640 |
| 2023 | $5,207 | $83,920 | $7,240 | $76,680 |
| 2022 | $4,052 | $83,920 | $7,240 | $76,680 |
| 2021 | $3,281 | $65,360 | $7,240 | $58,120 |
| 2020 | $2,849 | $56,240 | $7,240 | $49,000 |
| 2019 | $2,249 | $42,960 | $7,303 | $35,657 |
| 2018 | $1,970 | $42,959 | $7,303 | $35,656 |
| 2017 | $2,258 | $42,960 | $7,240 | $35,720 |
| 2016 | $1,674 | $29,664 | $6,526 | $23,138 |
| 2014 | $1,202 | $32,960 | $7,240 | $25,720 |
Source: Public Records
Map
Nearby Homes
- 6731 Browns Mill Trail
- 7056 Mahonia Place
- 7037 Mahonia Place
- 4741 Bob White Run
- 4719 Browns Mill Dr
- 7012 Setters Way
- 4647 Lantern Ct
- 4273 Chestnut Lake Ave
- 7023 Setters Way
- 7144 Browns Mill Rd
- 7134 Browns Mill Rd
- 7126 Browns Mill Rd
- 7134 Ravenwood Ln
- 7100 Browns Mill Rd
- 6874 Mahonia Place
- 6837 Mahonia Place
- 7078 Ravenwood Ln
- 7074 Ravenwood Ln
- 6941 Roane Ct
- 7069 Ravenwood Ln
- 4731 Browns Mill Ferry Rd Unit I
- 4711 Browns Mill Ferry Rd
- 6735 Browns Mill Trail Unit 1
- 4735 Browns Mill Ferry Rd
- 4703 Browns Mill Ferry Rd
- 4722 Browns Mill Ferry Rd
- 4722 Browns Mill Ferry Rd Unit 4722
- 4722 Browns Mill Ferry Rd
- 6738 Browns Mill Trail
- 6738 Browns Mill Trail
- 4710 Browns Mill Ferry Rd
- 4732 Browns Mill Ferry Rd Unit I
- 6738 Browns Mill Trail
- 0 Browns Mill Ferry Rd Unit 7443332
- 0 Browns Mill Ferry Rd Unit 7083441
- 0 Browns Mill Ferry Rd Unit 7439766
- 0 Browns Mill Ferry Rd Unit 7427271
- 0 Browns Mill Ferry Rd Unit 3255447
- 0 Browns Mill Ferry Rd Unit 3182683
- 0 Browns Mill Ferry Rd Unit 3162726