Estimated Value: $402,000 - $513,000
--
Bed
4
Baths
2,914
Sq Ft
$153/Sq Ft
Est. Value
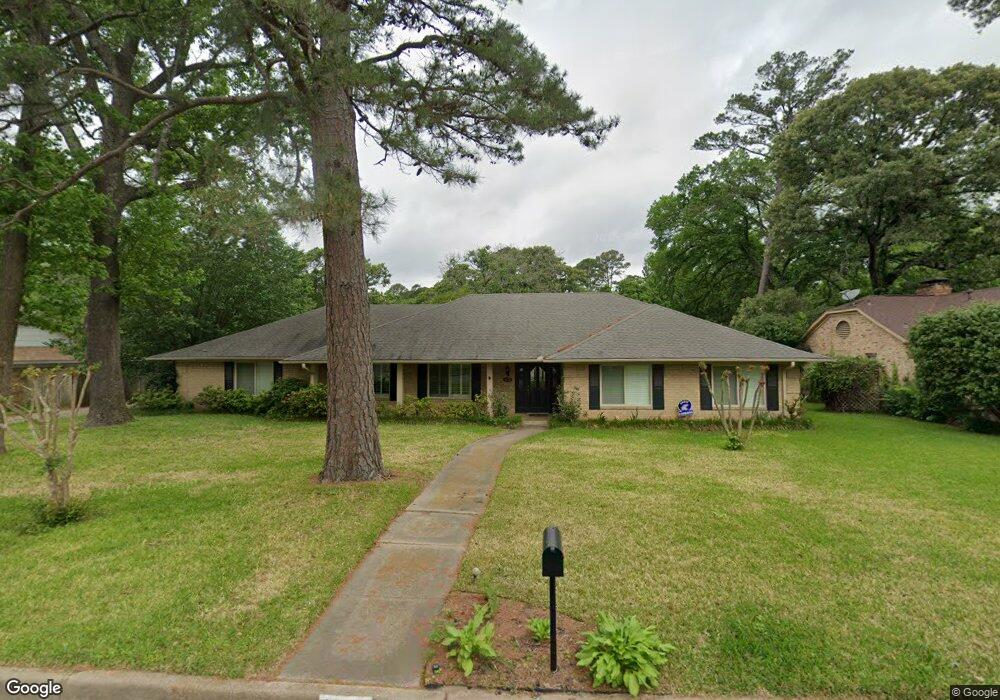
About This Home
This home is located at 4721 Kidd Dr, Tyler, TX 75703 and is currently estimated at $445,246, approximately $152 per square foot. 4721 Kidd Dr is a home located in Smith County with nearby schools including Woods Elementary School, Hubbard Middle School, and Tyler Legacy High School.
Ownership History
Date
Name
Owned For
Owner Type
Purchase Details
Closed on
Jan 10, 2020
Sold by
Killion Coy L and Killion Julie C
Bought by
Bazzell Scott L and Bazzell Rebeca Lynn
Current Estimated Value
Purchase Details
Closed on
Jan 30, 2015
Sold by
Knarr Donald Richard and Knarr Susan Lynn
Bought by
Killion Coy L and Killion Julie C
Home Financials for this Owner
Home Financials are based on the most recent Mortgage that was taken out on this home.
Original Mortgage
$228,937
Interest Rate
4.87%
Mortgage Type
FHA
Purchase Details
Closed on
Jul 3, 2007
Sold by
Shafer Gary L and Shafer Deborah L
Bought by
Knarr Ii Donald Richard and Knarr Susan Lynn
Home Financials for this Owner
Home Financials are based on the most recent Mortgage that was taken out on this home.
Original Mortgage
$193,600
Interest Rate
6.37%
Mortgage Type
Purchase Money Mortgage
Create a Home Valuation Report for This Property
The Home Valuation Report is an in-depth analysis detailing your home's value as well as a comparison with similar homes in the area
Home Values in the Area
Average Home Value in this Area
Purchase History
| Date | Buyer | Sale Price | Title Company |
|---|---|---|---|
| Bazzell Scott L | -- | None Available | |
| Killion Coy L | -- | None Available | |
| Knarr Ii Donald Richard | -- | Fa |
Source: Public Records
Mortgage History
| Date | Status | Borrower | Loan Amount |
|---|---|---|---|
| Previous Owner | Killion Coy L | $228,937 | |
| Previous Owner | Knarr Ii Donald Richard | $193,600 |
Source: Public Records
Tax History Compared to Growth
Tax History
| Year | Tax Paid | Tax Assessment Tax Assessment Total Assessment is a certain percentage of the fair market value that is determined by local assessors to be the total taxable value of land and additions on the property. | Land | Improvement |
|---|---|---|---|---|
| 2025 | $5,999 | $445,033 | $62,156 | $382,877 |
| 2024 | $5,999 | $412,359 | $50,460 | $393,247 |
| 2023 | $6,535 | $420,833 | $50,460 | $370,373 |
| 2022 | $6,677 | $342,742 | $50,460 | $292,282 |
| 2021 | $6,500 | $309,812 | $50,460 | $259,352 |
| 2020 | $6,375 | $297,934 | $50,460 | $247,474 |
| 2019 | $4,165 | $270,322 | $25,230 | $245,092 |
| 2018 | $5,671 | $260,766 | $25,230 | $235,536 |
| 2017 | $5,567 | $260,766 | $25,230 | $235,536 |
| 2016 | $5,089 | $238,346 | $25,230 | $213,116 |
| 2015 | $4,443 | $231,098 | $25,230 | $205,868 |
| 2014 | $4,443 | $221,083 | $25,230 | $195,853 |
Source: Public Records
Map
Nearby Homes
- 1507 Kensington Dr
- 1707 Picadilly Place
- 4805 Wendover Place
- 1705 Devonshire Dr
- 1401 Kidd Dr
- 1811 Picadilly Place
- 1809 Chipco Dr
- 1818 Kensington Dr
- 5104 Kingspark Cir
- 5112 Timber Creek Dr
- 5133 Avenham Ct
- 1608 Yosemite Dr
- 1021 Kingspark Dr
- 4601 Cambridge Dr
- 5117 Stagecoach Dr
- 5117 Stagecoach St
- 1807 Kimwood Ln
- 817 Woodhall Ct
- 842 Ashford Ct
- 1792 Stonecrest Blvd
- 4721 4721 Kidd Dr
- 4717 4717 Kidd Dr
- 4725 Kidd Dr
- 4717 Kidd Dr
- 1511 Devonshire Dr
- 4722 Downing St
- 4722 4722 Downing
- 4728 Downing St
- 4720 Kidd Dr
- 4801 Kidd Dr
- 4800 Kidd Dr
- 4720 4720 Kidd Dr
- 4800 4800 Downing
- 4800 Downing St
- 1520 Devonshire Dr
- 1512 1512 Devonshire
- 1512 Devonshire Dr
- 1421 1421 Devonshire
- 4716 Kidd Dr
- 4723 Picadilly Place