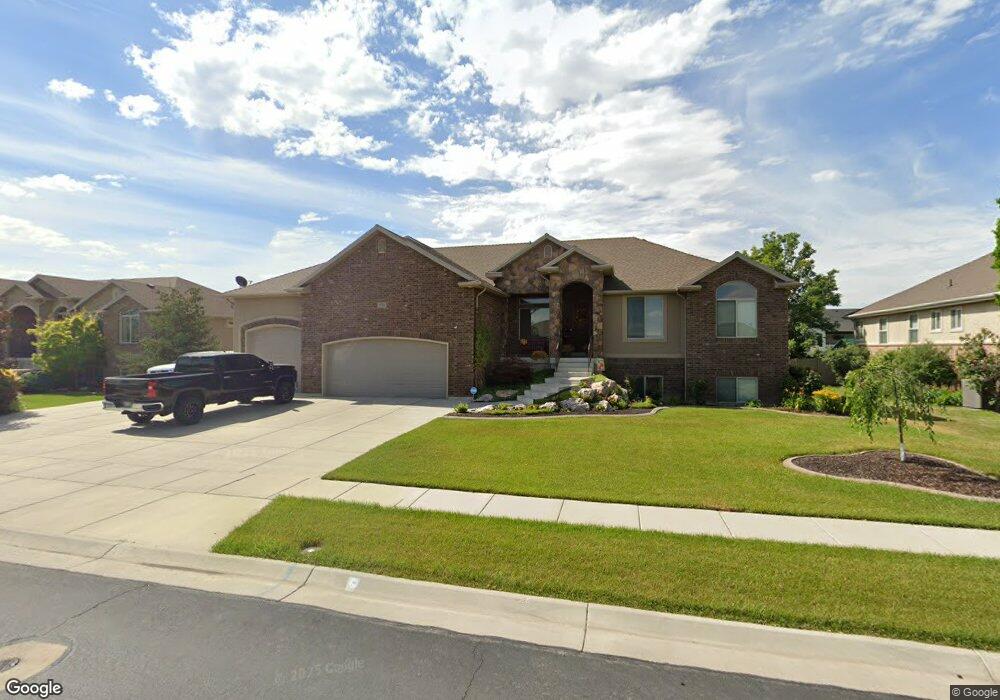
4721 W 4100 S West Haven, UT 84401
Estimated Value: $704,000 - $914,000
3
Beds
3
Baths
4,100
Sq Ft
$189/Sq Ft
Est. Value
About This Home
This home is located at 4721 W 4100 S, West Haven, UT 84401 and is currently estimated at $772,881, approximately $188 per square foot. 4721 W 4100 S is a home located in Weber County with nearby schools including Country View School, Rocky Mountain Junior High School, and Fremont High School.
Ownership History
Date
Name
Owned For
Owner Type
Purchase Details
Closed on
Jun 7, 2022
Sold by
Nichols Kennetii R
Bought by
Nichols Kenneth R and Nichols Lori Lynn
Current Estimated Value
Purchase Details
Closed on
Apr 12, 2022
Sold by
Nichols Kenneth R
Bought by
Ebj-2 Llc
Purchase Details
Closed on
Jun 8, 2009
Sold by
Fair Grove Homes Llc
Bought by
Nichols Kenneth R
Purchase Details
Closed on
Apr 21, 2009
Sold by
Fair Grove Construction Inc
Bought by
Fair Grove Homes Llc
Create a Home Valuation Report for This Property
The Home Valuation Report is an in-depth analysis detailing your home's value as well as a comparison with similar homes in the area
Home Values in the Area
Average Home Value in this Area
Purchase History
| Date | Buyer | Sale Price | Title Company |
|---|---|---|---|
| Nichols Kenneth R | -- | None Listed On Document | |
| Ebj-2 Llc | -- | None Listed On Document | |
| Nichols Kenneth R | -- | Founders Title Company Syrac | |
| Fair Grove Homes Llc | -- | Intermountain Title |
Source: Public Records
Tax History Compared to Growth
Tax History
| Year | Tax Paid | Tax Assessment Tax Assessment Total Assessment is a certain percentage of the fair market value that is determined by local assessors to be the total taxable value of land and additions on the property. | Land | Improvement |
|---|---|---|---|---|
| 2025 | $4,254 | $706,073 | $252,064 | $454,009 |
| 2024 | $4,080 | $382,249 | $138,635 | $243,614 |
| 2023 | $4,159 | $390,500 | $139,093 | $251,407 |
| 2022 | $3,944 | $378,950 | $139,093 | $239,857 |
| 2021 | $3,351 | $540,000 | $123,411 | $416,589 |
| 2020 | $3,137 | $462,000 | $98,548 | $363,452 |
| 2019 | $3,148 | $439,000 | $93,584 | $345,416 |
| 2018 | $3,047 | $406,000 | $88,640 | $317,360 |
| 2017 | $2,888 | $373,000 | $88,928 | $284,072 |
| 2016 | $2,906 | $204,188 | $41,523 | $162,665 |
| 2015 | $2,816 | $196,442 | $41,523 | $154,919 |
| 2014 | $2,615 | $177,417 | $41,523 | $135,894 |
Source: Public Records
Map
Nearby Homes
- 4712 W 4100 S
- 4126 S 4950 W
- 4521 W 3950 S Unit 5
- 4512 W 3925 S Unit 20
- 3880 S 4550 W
- 3238 S 4950 W
- 3243 S 4950 W Unit 25
- 3263 S 4950 W Unit 24
- 3225 S 4950 W Unit 26
- 3198 S 4950 W Unit 29
- 3192 S 4950 W Unit 28
- 3233 S 4975 W Unit 14
- 3223 S 4975 W Unit 15
- 3257 S 4975 W Unit 12
- 3269 S 4975 W Unit 11
- 3191 S 5100 St W Unit 1
- 4589 W 3725 S Unit 248
- 4585 W 3725 S Unit 246
- 4622 W 3725 S Unit 231
- 4618 W 3725 S Unit 233
- 4741 W 4100 S
- 4715 W 4100 S
- 4722 W 4150 S
- 4720 W 4100 S
- 4710 W 4150 S Unit 24
- 4738 W 4100 S
- 4751 W 4100 S
- 4748 W 4100 S
- 4756 W 4150 S
- 4744 W 4150 S
- 4695 W 4100 S
- 4725 W 4050 S
- 4739 W 4050 S
- 4094 S 4775 W
- 4771 W 4100 S
- 4753 W 4050 S
- 5777 W 4100 S Unit 111
- 3929 W 4100 S Unit 84
- 5741 W 4100 S Unit 109
- 5713 W 4100 S Unit 106