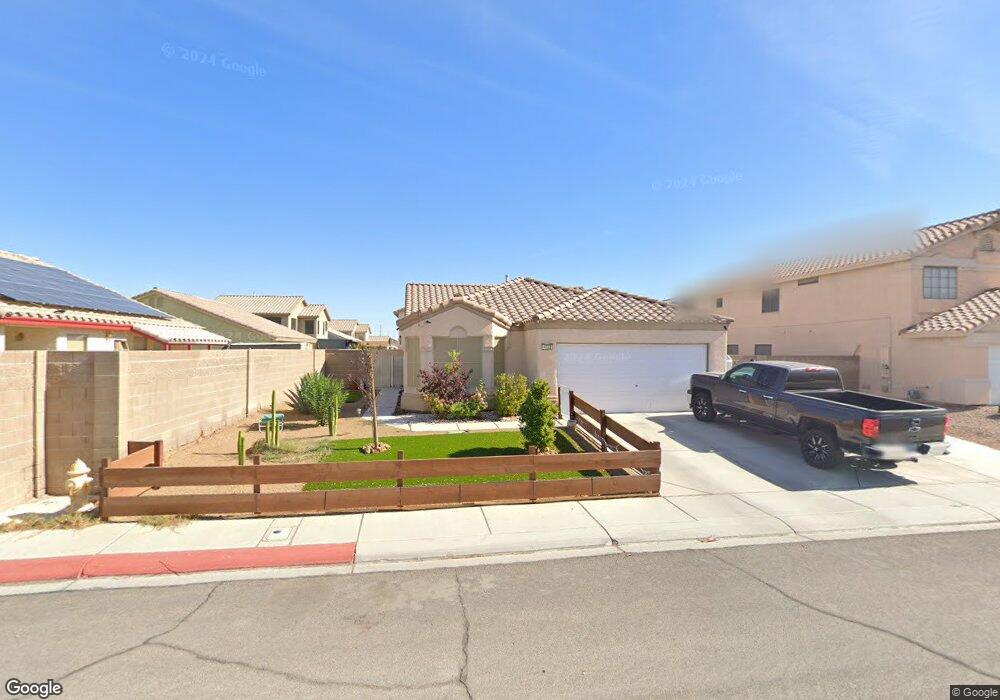
4722 Boulder Bay St North Las Vegas, NV 89081
Northridge NeighborhoodEstimated Value: $382,000 - $394,000
3
Beds
2
Baths
1,557
Sq Ft
$249/Sq Ft
Est. Value
About This Home
This home is located at 4722 Boulder Bay St, North Las Vegas, NV 89081 and is currently estimated at $388,062, approximately $249 per square foot. 4722 Boulder Bay St is a home located in Clark County with nearby schools including Raul P. Elizondo Elementary School, Clifford O. Findlay Middle School, and Mojave High School.
Ownership History
Date
Name
Owned For
Owner Type
Purchase Details
Closed on
Sep 17, 2020
Sold by
Barrera Jorge and De Barrera Maria
Bought by
Barrera Jorge and Barrera Maria Esther
Current Estimated Value
Home Financials for this Owner
Home Financials are based on the most recent Mortgage that was taken out on this home.
Original Mortgage
$166,683
Outstanding Balance
$147,920
Interest Rate
2.9%
Mortgage Type
New Conventional
Estimated Equity
$240,142
Purchase Details
Closed on
Jun 7, 2016
Sold by
Conzemius Vernon C and Conzemius Mary Lou
Bought by
Barrera Jorge E and Barrera Maria Frias
Home Financials for this Owner
Home Financials are based on the most recent Mortgage that was taken out on this home.
Original Mortgage
$171,830
Interest Rate
4.5%
Mortgage Type
FHA
Purchase Details
Closed on
Jun 10, 1998
Sold by
Del Webbs Coventry Homes Of Nevada Inc
Bought by
Conzemius Vernon C and Conzemius Mary Lou
Create a Home Valuation Report for This Property
The Home Valuation Report is an in-depth analysis detailing your home's value as well as a comparison with similar homes in the area
Home Values in the Area
Average Home Value in this Area
Purchase History
| Date | Buyer | Sale Price | Title Company |
|---|---|---|---|
| Barrera Jorge | -- | Driggs Title Agency Inc | |
| Barrera Jorge E | $175,000 | Nevada Title Las Vegas | |
| Conzemius Vernon C | $119,000 | First American Title Co |
Source: Public Records
Mortgage History
| Date | Status | Borrower | Loan Amount |
|---|---|---|---|
| Open | Barrera Jorge | $166,683 | |
| Closed | Barrera Jorge E | $171,830 |
Source: Public Records
Tax History Compared to Growth
Tax History
| Year | Tax Paid | Tax Assessment Tax Assessment Total Assessment is a certain percentage of the fair market value that is determined by local assessors to be the total taxable value of land and additions on the property. | Land | Improvement |
|---|---|---|---|---|
| 2025 | $1,466 | $95,577 | $31,500 | $64,077 |
| 2024 | $1,424 | $95,577 | $31,500 | $64,077 |
| 2023 | $1,089 | $90,904 | $30,100 | $60,804 |
| 2022 | $1,515 | $78,880 | $23,100 | $55,780 |
| 2021 | $1,403 | $76,102 | $23,100 | $53,002 |
| 2020 | $1,300 | $74,014 | $21,350 | $52,664 |
| 2019 | $1,218 | $69,757 | $17,850 | $51,907 |
| 2018 | $1,163 | $64,832 | $14,700 | $50,132 |
| 2017 | $1,907 | $56,858 | $12,600 | $44,258 |
| 2016 | $1,089 | $48,872 | $9,800 | $39,072 |
| 2015 | $1,086 | $38,569 | $7,000 | $31,569 |
| 2014 | $1,054 | $30,496 | $5,250 | $25,246 |
Source: Public Records
Map
Nearby Homes
- 748 Stagecoach Ave
- 1106 Granite Ash Ave
- 4640 Cliff Breeze Dr
- 555 E Lone Mountain Rd
- 1016 Stoneypeak Ave
- 4848 Cutting Diamond Ct
- 4534 Roper Ct
- 1014 Edgestone Mark Ave
- 4935 Stormy Ridge St
- 4543 Shannon Jean Ct
- 4728 Cloudy Morning St
- 4526 Shannon Jean Ct
- 5013 Drifting Pebble St
- 4746 Roby Grey Way
- 1014 Cliffbrook Hedge Ave
- 1310 Ripplestone Ave
- 1022 Cliffbrook Hedge Ave Unit 3
- 1512 Groom Ave
- 729 Gullwing Ln
- 609 El Gusto Ave
- 4718 Boulder Bay St
- 913 Rocky Stone Ave
- 917 Rocky Stone Ave
- 4717 Granite Cove Ct
- 4721 Boulder Bay St
- 4725 Boulder Bay St
- 4713 Granite Cove Ct
- 4729 Boulder Bay St
- 4717 Boulder Bay St
- 1003 Rocky Stone Ave
- 4713 Boulder Bay St
- 4733 Boulder Bay St
- 910 Rocky Stone Ave
- 914 Rocky Stone Ave
- 1007 Rocky Stone Ave
- 4720 Granite Cove Ct
- 918 Rocky Stone Ave
- 918 Rocky Stone Ave
- 918 Rocky Stone Ave