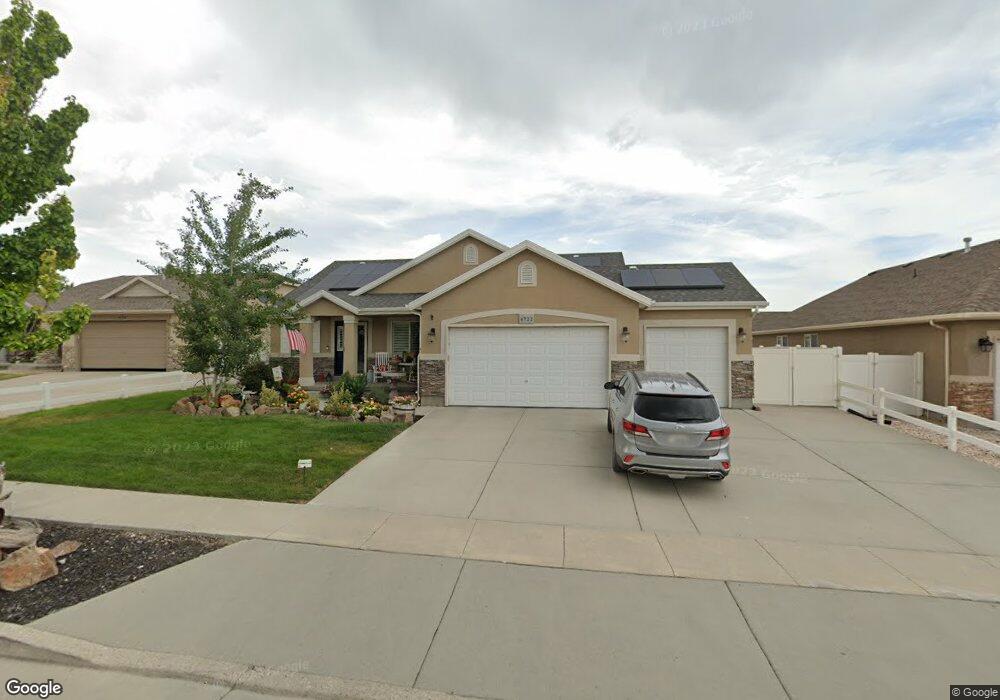
4722 W Magnum Ct Herriman, UT 84096
Estimated Value: $635,000 - $672,623
3
Beds
3
Baths
3,222
Sq Ft
$202/Sq Ft
Est. Value
About This Home
This home is located at 4722 W Magnum Ct, Herriman, UT 84096 and is currently estimated at $649,406, approximately $201 per square foot. 4722 W Magnum Ct is a home located in Salt Lake County with nearby schools including Midas Creek Elementary School, Copper Mountain Middle School, and Herriman High School.
Ownership History
Date
Name
Owned For
Owner Type
Purchase Details
Closed on
Dec 7, 2021
Sold by
Sorensen Pamela B
Bought by
Pamela B Sorensen 2021 Trust and Sorensen
Current Estimated Value
Purchase Details
Closed on
Nov 24, 2021
Sold by
Sorensen Pamela B
Bought by
Sorensen Pamela B and Pamela B Sorensen 2021 Trust
Purchase Details
Closed on
Sep 20, 2017
Sold by
Martinez Douglas R and Martinez Kathy L
Bought by
Sorensen Kevin R and Sorensen Pamela B
Home Financials for this Owner
Home Financials are based on the most recent Mortgage that was taken out on this home.
Original Mortgage
$301,500
Interest Rate
3.9%
Mortgage Type
New Conventional
Purchase Details
Closed on
Apr 15, 2004
Sold by
Mcarthur Homes At Legacy Ranch Lc
Bought by
Martinez Douglas R and Martinez Kathy L
Home Financials for this Owner
Home Financials are based on the most recent Mortgage that was taken out on this home.
Original Mortgage
$103,200
Interest Rate
5.57%
Mortgage Type
Purchase Money Mortgage
Create a Home Valuation Report for This Property
The Home Valuation Report is an in-depth analysis detailing your home's value as well as a comparison with similar homes in the area
Home Values in the Area
Average Home Value in this Area
Purchase History
| Date | Buyer | Sale Price | Title Company |
|---|---|---|---|
| Pamela B Sorensen 2021 Trust | -- | -- | |
| Sorensen Pamela B | -- | Accommodation | |
| Sorensen Kevin R | -- | Title Guarantee | |
| Martinez Douglas R | -- | Surety Title |
Source: Public Records
Mortgage History
| Date | Status | Borrower | Loan Amount |
|---|---|---|---|
| Previous Owner | Sorensen Kevin R | $301,500 | |
| Previous Owner | Martinez Douglas R | $103,200 |
Source: Public Records
Tax History Compared to Growth
Tax History
| Year | Tax Paid | Tax Assessment Tax Assessment Total Assessment is a certain percentage of the fair market value that is determined by local assessors to be the total taxable value of land and additions on the property. | Land | Improvement |
|---|---|---|---|---|
| 2025 | $3,787 | $638,600 | $153,000 | $485,600 |
| 2024 | $3,787 | $621,200 | $148,300 | $472,900 |
| 2023 | $3,787 | $595,300 | $146,700 | $448,600 |
| 2022 | $3,914 | $605,700 | $143,800 | $461,900 |
| 2021 | $3,315 | $450,300 | $116,900 | $333,400 |
| 2020 | $3,106 | $397,700 | $93,500 | $304,200 |
| 2019 | $3,130 | $394,100 | $93,500 | $300,600 |
| 2018 | $2,981 | $369,500 | $90,600 | $278,900 |
| 2017 | $2,526 | $312,300 | $90,600 | $221,700 |
| 2016 | $2,526 | $297,100 | $90,600 | $206,500 |
| 2015 | $2,482 | $282,800 | $92,300 | $190,500 |
| 2014 | $2,392 | $267,000 | $88,000 | $179,000 |
Source: Public Records
Map
Nearby Homes
- 12284 S Flintlock Way
- 12363 Stockade Ln
- 4587 W Flintlock Way
- 12694 S Lincoln Peak Ln Unit 116
- 12694 S Lincoln Peak Ln
- 12688 S Lincoln Peak Ln Unit 115
- 12688 S Lincoln Peak Ln
- 12686 Lincoln Peak Ln
- 12682 S Lincoln Peak Ln
- 12682 S Lincoln Peak Ln Unit 113
- 12676 S Lincoln Peak Ln
- 12676 S Lincoln Peak Ln Unit 112
- 12674 S Lincoln Peak Ln
- 12674 S Lincoln Peak Ln Unit 111
- 12668 S Lincoln Peak Ln Unit 109
- 4768 W Liberation Dr
- 12693 S Lincoln Peak Ln
- 12687 S Lincoln Peak Ln Unit 126
- 12687 S Lincoln Peak Ln
- 12671 S Lincoln Peak Ln Unit 131
- 4722 Magnum Ct
- 4712 Magnum Ct
- 4712 W Magnum Ct
- 4734 Magnum Ct
- 4734 W Magnum Ct
- 4721 Black Powder Dr
- 4721 W Black Powder Dr
- 4709 Black Powder Dr
- 4709 W Black Powder Dr
- 4731 Black Powder Dr
- 4731 W Black Powder Dr
- 4721 Magnum Ct
- 4721 W Magnum Ct
- 4743 W Black Powder Dr
- 4711 Magnum Ct
- 4711 W Magnum Ct
- 4743 Black Powder Dr
- 4731 W Magnum Ct
- 4731 Magnum Ct
- 4744 Magnum Ct