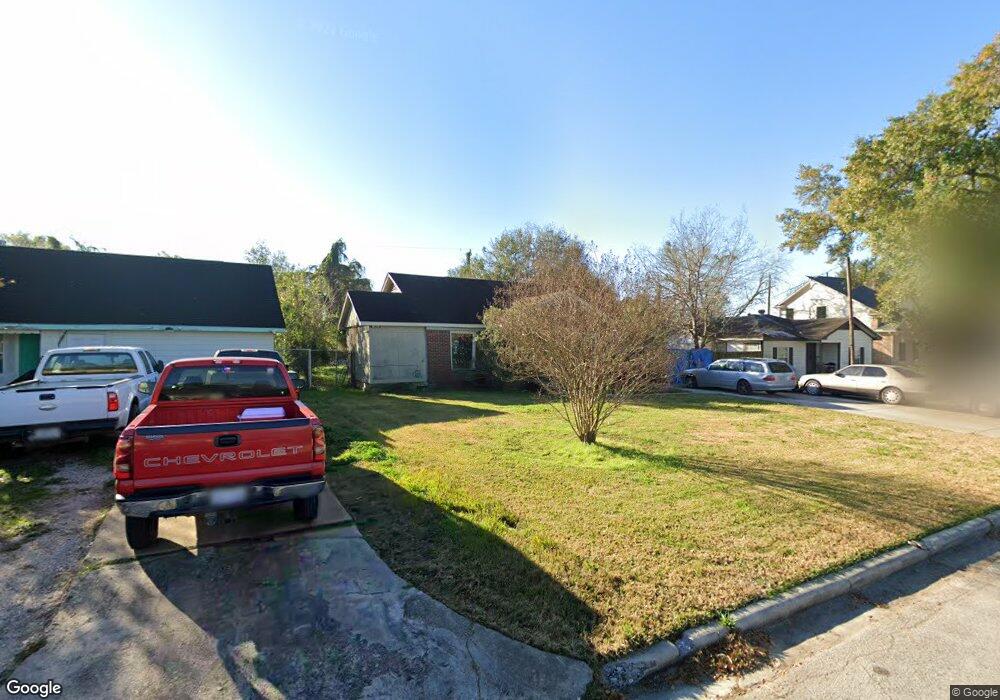
4722 Winnetka St Houston, TX 77021
OST-South Union NeighborhoodEstimated Value: $129,000 - $362,000
3
Beds
1
Bath
1,573
Sq Ft
$158/Sq Ft
Est. Value
About This Home
This home is located at 4722 Winnetka St, Houston, TX 77021 and is currently estimated at $247,943, approximately $157 per square foot. 4722 Winnetka St is a home located in Harris County with nearby schools including Peck Elementary School, Cullen Middle School, and Yates High School.
Ownership History
Date
Name
Owned For
Owner Type
Purchase Details
Closed on
May 1, 2023
Sold by
W12 Homes Llc
Bought by
Jones Ladwig Vallas
Current Estimated Value
Home Financials for this Owner
Home Financials are based on the most recent Mortgage that was taken out on this home.
Original Mortgage
$193,000
Interest Rate
6.79%
Mortgage Type
Seller Take Back
Purchase Details
Closed on
Sep 2, 2022
Sold by
Scott Wizig
Bought by
W12 Homes Llc
Purchase Details
Closed on
Jun 1, 2013
Sold by
W12 Homes Llc
Bought by
Grant Anthony D
Home Financials for this Owner
Home Financials are based on the most recent Mortgage that was taken out on this home.
Original Mortgage
$112,500
Interest Rate
4.34%
Mortgage Type
Purchase Money Mortgage
Purchase Details
Closed on
Sep 4, 2012
Sold by
Cox M L
Bought by
W 12 Homes Llc
Create a Home Valuation Report for This Property
The Home Valuation Report is an in-depth analysis detailing your home's value as well as a comparison with similar homes in the area
Home Values in the Area
Average Home Value in this Area
Purchase History
| Date | Buyer | Sale Price | Title Company |
|---|---|---|---|
| Jones Ladwig Vallas | -- | None Listed On Document | |
| W12 Homes Llc | $100,000 | None Listed On Document | |
| Grant Anthony D | -- | None Available | |
| W 12 Homes Llc | $16,900 | None Available |
Source: Public Records
Mortgage History
| Date | Status | Borrower | Loan Amount |
|---|---|---|---|
| Previous Owner | Jones Ladwig Vallas | $193,000 | |
| Previous Owner | Grant Anthony D | $112,500 |
Source: Public Records
Tax History Compared to Growth
Tax History
| Year | Tax Paid | Tax Assessment Tax Assessment Total Assessment is a certain percentage of the fair market value that is determined by local assessors to be the total taxable value of land and additions on the property. | Land | Improvement |
|---|---|---|---|---|
| 2025 | $3,525 | $148,525 | $148,425 | $100 |
| 2024 | $3,525 | $168,462 | $150,192 | $18,270 |
| 2023 | $3,525 | $195,123 | $150,192 | $44,931 |
| 2022 | $4,675 | $201,777 | $133,504 | $68,273 |
| 2021 | $3,527 | $151,323 | $116,816 | $34,507 |
| 2020 | $3,215 | $126,735 | $83,440 | $43,295 |
| 2019 | $2,884 | $109,000 | $75,096 | $33,904 |
| 2018 | $2,734 | $108,056 | $65,151 | $42,905 |
| 2017 | $2,638 | $99,774 | $50,439 | $49,335 |
| 2016 | $1,944 | $73,536 | $39,931 | $33,605 |
| 2015 | -- | $70,285 | $39,931 | $30,354 |
| 2014 | -- | $49,950 | $39,931 | $10,019 |
Source: Public Records
Map
Nearby Homes
- 4735 Marietta Ln
- 4711 Marietta Ln
- 4826 Culmore Dr
- 4435 Old Spanish Trail
- 4838 Marietta Ln
- 4918 Culmore Dr
- 4807 Eppes St
- 4826 Ventura Ln
- 4930 Culmore Dr
- 4850 Marietta Ln
- 4914 Gammage St
- 4902 Marietta Ln
- 4327 Alconbury Ln
- 4923 Winnetka St
- 3917, 3919 Griggs Rd
- 4910 Eppes St
- 4928 Old Spanish Trail
- 4310 Fernwood Dr
- 4315 Fernwood Dr
- 5610 Milart St
- 4726 Winnetka St
- 4718 Winnetka St
- 4730 Winnetka St
- 4731 Arvilla Ln
- 4714 Winnetka St
- 4735 Arvilla Ln
- 4727 Arvilla Ln
- 4739 Arvilla Ln
- 4723 Arvilla Ln
- 4734 Winnetka St
- 4719 Winnetka St
- 4743 Arvilla Ln
- 4710 Winnetka St
- 4723 Winnetka St
- 4715 Winnetka St
- 4719 Arvilla Ln
- 4711 Winnetka St
- 4727 Winnetka St
- 4803 Arvilla Ln
- 4738 Winnetka St