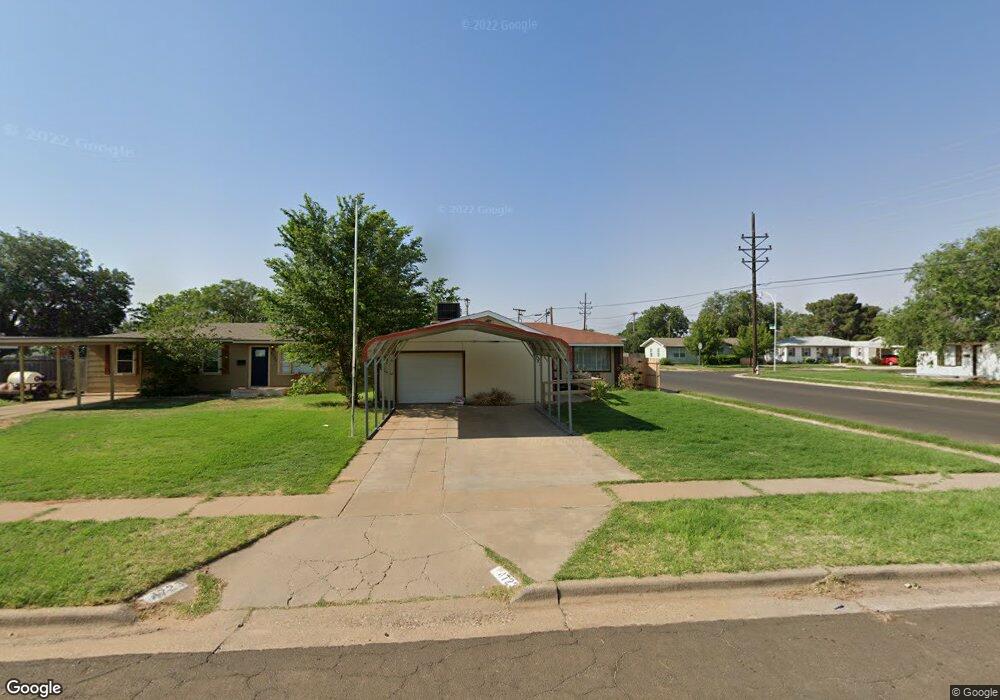
4723 39th St Lubbock, TX 79414
Stubbs-Stewart NeighborhoodEstimated Value: $124,000 - $138,562
3
Beds
2
Baths
1,250
Sq Ft
$106/Sq Ft
Est. Value
About This Home
This home is located at 4723 39th St, Lubbock, TX 79414 and is currently estimated at $132,891, approximately $106 per square foot. 4723 39th St is a home located in Lubbock County with nearby schools including Stewart Elementary School, Irons Middle School, and Coronado High School.
Ownership History
Date
Name
Owned For
Owner Type
Purchase Details
Closed on
Jun 17, 2020
Sold by
Garza Andrew
Bought by
T & D Real Estate And Rentals Llc
Current Estimated Value
Home Financials for this Owner
Home Financials are based on the most recent Mortgage that was taken out on this home.
Original Mortgage
$101,134
Outstanding Balance
$89,449
Interest Rate
3.2%
Mortgage Type
FHA
Estimated Equity
$43,442
Purchase Details
Closed on
Aug 7, 2018
Sold by
Salaz Mary Alice
Bought by
Gill Holly Rachelle
Home Financials for this Owner
Home Financials are based on the most recent Mortgage that was taken out on this home.
Original Mortgage
$101,134
Interest Rate
4.87%
Mortgage Type
FHA
Purchase Details
Closed on
Feb 24, 2014
Sold by
Vincent Shayne
Bought by
Salaz Mary Alice
Purchase Details
Closed on
Dec 6, 2006
Sold by
Bank Of New York
Bought by
Hud
Purchase Details
Closed on
Dec 5, 2006
Sold by
Sumpter Crystal and Sumpter Shelby
Bought by
Bank Of New York and Certificateholders Cwabs Ii Inc Lft 2005
Create a Home Valuation Report for This Property
The Home Valuation Report is an in-depth analysis detailing your home's value as well as a comparison with similar homes in the area
Home Values in the Area
Average Home Value in this Area
Purchase History
| Date | Buyer | Sale Price | Title Company |
|---|---|---|---|
| T & D Real Estate And Rentals Llc | -- | Western Title Company | |
| Gill Holly Rachelle | -- | Hub City Title | |
| Salaz Mary Alice | -- | Western Title Co | |
| Hud | -- | None Available | |
| Bank Of New York | $56,235 | None Available |
Source: Public Records
Mortgage History
| Date | Status | Borrower | Loan Amount |
|---|---|---|---|
| Open | T & D Real Estate And Rentals Llc | $101,134 | |
| Previous Owner | Gill Holly Rachelle | $101,134 |
Source: Public Records
Tax History
| Year | Tax Paid | Tax Assessment Tax Assessment Total Assessment is a certain percentage of the fair market value that is determined by local assessors to be the total taxable value of land and additions on the property. | Land | Improvement |
|---|---|---|---|---|
| 2025 | $1,372 | $112,633 | $23,000 | $89,633 |
| 2024 | $23 | $128,874 | $23,000 | $105,874 |
| 2023 | $2,254 | $121,248 | $6,350 | $114,898 |
| 2022 | $2,101 | $103,803 | $6,350 | $97,453 |
| 2021 | $2,010 | $93,850 | $6,350 | $87,500 |
| 2020 | $1,850 | $85,100 | $6,350 | $78,750 |
| 2019 | $1,542 | $68,694 | $6,350 | $62,344 |
| 2018 | $1,502 | $66,809 | $6,350 | $60,459 |
| 2017 | $1,504 | $66,809 | $6,350 | $60,459 |
| 2016 | $1,428 | $63,451 | $6,350 | $57,101 |
| 2015 | $1,294 | $59,060 | $6,350 | $52,710 |
| 2014 | $1,294 | $58,190 | $3,250 | $54,940 |
Source: Public Records
Map
Nearby Homes