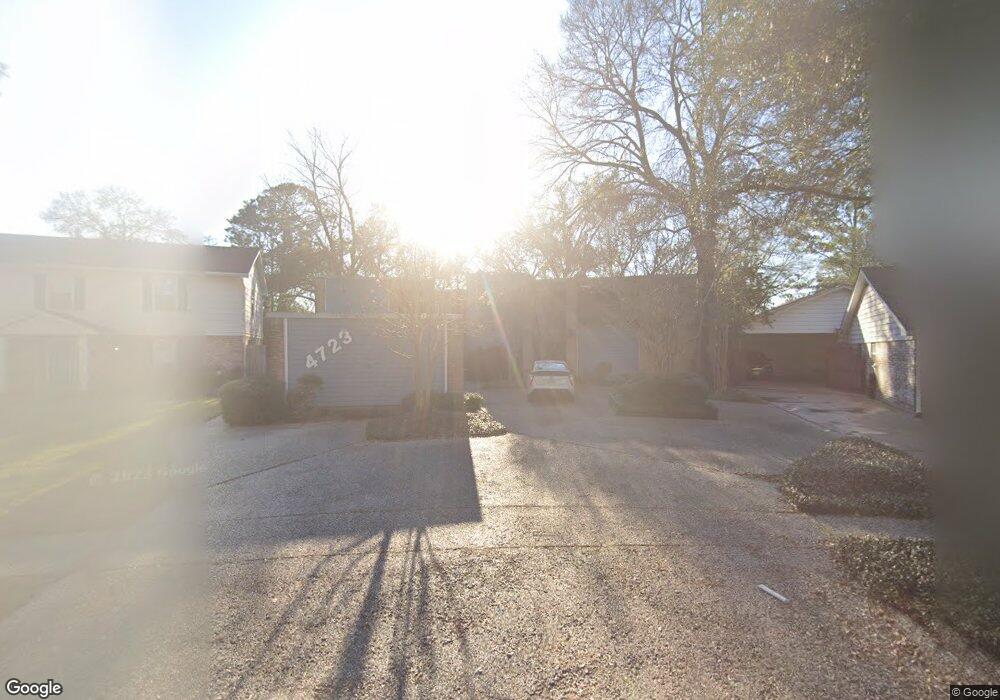
4723 Apollo St Houston, TX 77018
Oak Forest-Garden Oaks NeighborhoodEstimated Value: $1,048,000 - $1,740,000
6
Beds
6
Baths
6,242
Sq Ft
$221/Sq Ft
Est. Value
About This Home
This home is located at 4723 Apollo St, Houston, TX 77018 and is currently estimated at $1,379,670, approximately $221 per square foot. 4723 Apollo St is a home located in Harris County with nearby schools including Durham Elementary School, Frank Black Middle School, and Waltrip High School.
Ownership History
Date
Name
Owned For
Owner Type
Purchase Details
Closed on
Jul 25, 2017
Sold by
Perrone Steven M and Perrone Kerri
Bought by
Grossman Michael and Wolfe Roxanne
Current Estimated Value
Home Financials for this Owner
Home Financials are based on the most recent Mortgage that was taken out on this home.
Original Mortgage
$416,000
Outstanding Balance
$345,816
Interest Rate
3.91%
Mortgage Type
New Conventional
Estimated Equity
$1,033,854
Create a Home Valuation Report for This Property
The Home Valuation Report is an in-depth analysis detailing your home's value as well as a comparison with similar homes in the area
Home Values in the Area
Average Home Value in this Area
Purchase History
| Date | Buyer | Sale Price | Title Company |
|---|---|---|---|
| Grossman Michael | -- | None Available |
Source: Public Records
Mortgage History
| Date | Status | Borrower | Loan Amount |
|---|---|---|---|
| Open | Grossman Michael | $416,000 |
Source: Public Records
Tax History Compared to Growth
Tax History
| Year | Tax Paid | Tax Assessment Tax Assessment Total Assessment is a certain percentage of the fair market value that is determined by local assessors to be the total taxable value of land and additions on the property. | Land | Improvement |
|---|---|---|---|---|
| 2025 | $4,773 | $757,000 | $422,000 | $335,000 |
| 2024 | $4,773 | $793,515 | $422,000 | $371,515 |
| 2023 | $4,773 | $750,151 | $379,800 | $370,351 |
| 2022 | $15,416 | $700,125 | $379,800 | $320,325 |
| 2021 | $15,429 | $661,994 | $379,800 | $282,194 |
| 2020 | $15,093 | $623,290 | $316,500 | $306,790 |
| 2019 | $14,709 | $581,300 | $327,000 | $254,300 |
| 2018 | $7,212 | $618,366 | $327,000 | $291,366 |
| 2017 | $14,864 | $639,094 | $327,000 | $312,094 |
| 2016 | $13,513 | $639,094 | $327,000 | $312,094 |
| 2015 | $6,082 | $614,190 | $327,000 | $287,190 |
| 2014 | $6,082 | $500,000 | $272,500 | $227,500 |
Source: Public Records
Map
Nearby Homes
- 4626 Ella Blvd
- 1116 Cheshire Ln
- 1110 Cheshire Ln
- 1236 Martin St
- 1219 Candlelight Ln
- 1310 Chantilly Ln
- 1243 Candlelight Ln
- 4710 Brian Haven Dr
- 1306 Curtin St
- 1314 Richelieu Ln
- 1330 Richelieu Ln
- 1130 Bethlehem St
- 1322 Candlelight Ln
- 1550 Sue Barnett Dr
- 4314 Apollo St
- 1317 Chamboard Ln
- 1353 Chantilly Ln
- 1341 Candlelight Ln
- 1547 Sue Barnett Dr
- 1218 Lehman St
- 1125 Cheshire Ln
- 4725 Apollo St
- 1123 Cheshire Ln
- 4727 Apollo St
- 4634 Ella Blvd
- 4702 Ella Blvd
- 1166 Chantilly Ln
- 4630 Ella Blvd
- 4706 Ella Blvd
- 1122 Cheshire Ln
- 4710 Ella Bl
- 1121 Cheshire Ln
- 1162 Chantilly Ln
- 4729 Apollo St
- 4710 Ella Blvd
- 4715 Apollo St
- 4622 Ella Blvd
- 1120 Cheshire Ln
- 1158 Chantilly Ln
- 1115 Martin St