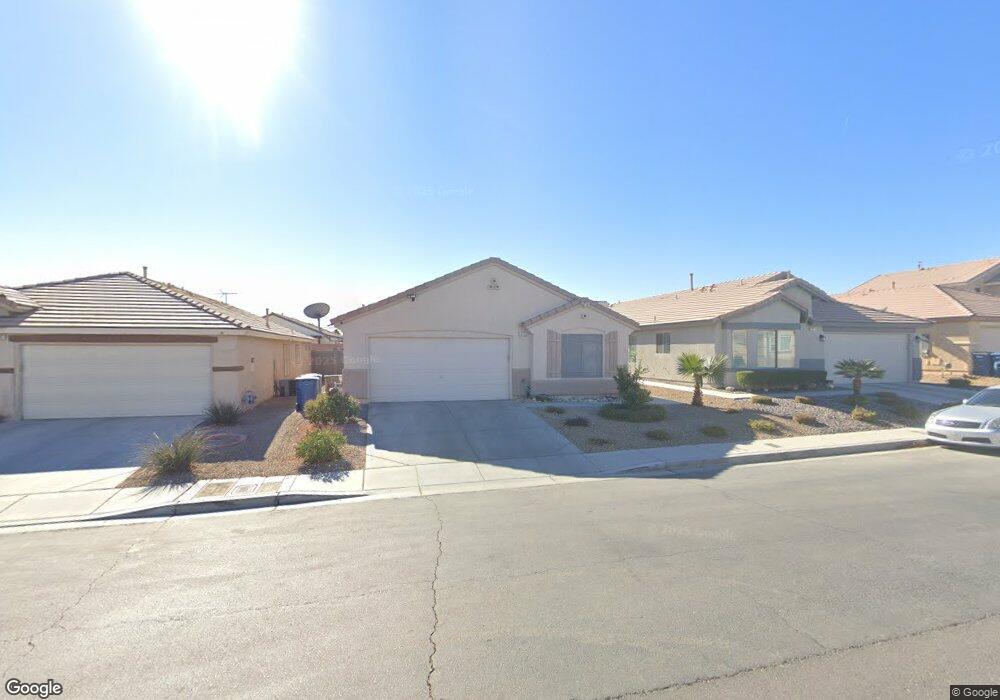
4723 Gracemont Ave Unit 3 Las Vegas, NV 89139
Coronado Ranch NeighborhoodEstimated Value: $413,209 - $451,000
3
Beds
2
Baths
1,505
Sq Ft
$286/Sq Ft
Est. Value
About This Home
This home is located at 4723 Gracemont Ave Unit 3, Las Vegas, NV 89139 and is currently estimated at $430,302, approximately $285 per square foot. 4723 Gracemont Ave Unit 3 is a home located in Clark County with nearby schools including Dr. Beverly S. Mathis Elementary School, Lawrence & Heidi Canarelli Middle School, and Desert Oasis High School.
Ownership History
Date
Name
Owned For
Owner Type
Purchase Details
Closed on
Dec 1, 2021
Sold by
Nguyen That Huong Thilan and Nguyen Huong Thilan
Bought by
Nguyen Huong Thilan and Pham Tony
Current Estimated Value
Purchase Details
Closed on
Jun 8, 2018
Sold by
Lopez Bernardo
Bought by
Nguyen Huong Thilan
Home Financials for this Owner
Home Financials are based on the most recent Mortgage that was taken out on this home.
Original Mortgage
$265,821
Outstanding Balance
$229,891
Interest Rate
4.5%
Mortgage Type
FHA
Estimated Equity
$200,411
Purchase Details
Closed on
Feb 1, 2013
Sold by
Lopez Bernardo
Bought by
Lopez Bernardo and Bernardo Lopez Trust
Purchase Details
Closed on
Jul 1, 2003
Sold by
Woodside Homes Of Nevada Inc
Bought by
Lopez Bernardo
Home Financials for this Owner
Home Financials are based on the most recent Mortgage that was taken out on this home.
Original Mortgage
$174,100
Interest Rate
5.22%
Mortgage Type
Unknown
Create a Home Valuation Report for This Property
The Home Valuation Report is an in-depth analysis detailing your home's value as well as a comparison with similar homes in the area
Home Values in the Area
Average Home Value in this Area
Purchase History
| Date | Buyer | Sale Price | Title Company |
|---|---|---|---|
| Nguyen Huong Thilan | -- | Ticor Title Henderson | |
| Nguyen Huong Thilan | $275,000 | Driggs Title Agency Inc | |
| Lopez Bernardo | -- | None Available | |
| Lopez Bernardo | $183,277 | United Title Of Nevada |
Source: Public Records
Mortgage History
| Date | Status | Borrower | Loan Amount |
|---|---|---|---|
| Open | Nguyen Huong Thilan | $265,821 | |
| Previous Owner | Lopez Bernardo | $174,100 |
Source: Public Records
Tax History Compared to Growth
Tax History
| Year | Tax Paid | Tax Assessment Tax Assessment Total Assessment is a certain percentage of the fair market value that is determined by local assessors to be the total taxable value of land and additions on the property. | Land | Improvement |
|---|---|---|---|---|
| 2025 | $1,581 | $107,065 | $40,250 | $66,815 |
| 2024 | $1,536 | $107,065 | $40,250 | $66,815 |
| 2023 | $1,536 | $94,375 | $31,500 | $62,875 |
| 2022 | $1,491 | $84,071 | $26,600 | $57,471 |
| 2021 | $1,448 | $79,065 | $24,500 | $54,565 |
| 2020 | $1,403 | $78,611 | $24,500 | $54,111 |
| 2019 | $1,362 | $74,684 | $21,350 | $53,334 |
| 2018 | $1,338 | $69,066 | $17,850 | $51,216 |
| 2017 | $2,044 | $69,679 | $17,850 | $51,829 |
| 2016 | $1,253 | $57,582 | $10,500 | $47,082 |
| 2015 | $1,250 | $43,987 | $9,800 | $34,187 |
| 2014 | $1,211 | $44,195 | $6,300 | $37,895 |
Source: Public Records
Map
Nearby Homes
- 7850 Flagler St Unit 2
- 4732 Lone Grove Dr
- 7682 Rafter Ct
- 4832 Englewood Ave
- 4801 Pagosa Springs Dr
- 7923 Homer Ct
- 4930 W Maulding Ave
- 7689 Black River St
- 4998 Lavaliere Ave
- 7514 Rogers St
- 7477 Ullom Dr
- 4315 W Maulding Ave
- 5081 Pine Mountain Ave
- 4895 Jubilee Diamond Ct
- 8175 Arville St Unit 99
- 8175 Arville St Unit 41
- 8175 Arville St Unit 315
- 8175 Arville St Unit 271
- 8175 Arville St Unit 171
- 8175 Arville St Unit 70
- 4741 Gracemont Ave Unit 3
- 4705 Gracemont Ave
- 4691 Gracemont Ave
- 4759 Gracemont Ave Unit 3
- 4732 Gracemont Ave Unit 3
- 4777 Gracemont Ave Unit 3
- 4679 Gracemont Ave
- 7807 Caring Nel Ct
- 7816 Caring Nel Ct Unit Lot 9
- 7816 Caring Nel Ct
- 4702 Gracemont Ave
- 4667 Gracemont Ave
- 7815 Caring Nel Ct Unit Lot 7
- 4795 Gracemont Ave
- 7801 Flagler St Unit 2
- 4722 Gracemont Ave
- 4770 Gracemont Ave
- 7806 Ullom Dr
- 7823 Caring Nel Ct
- 7806 S Ullom Dr Unit Lot 1