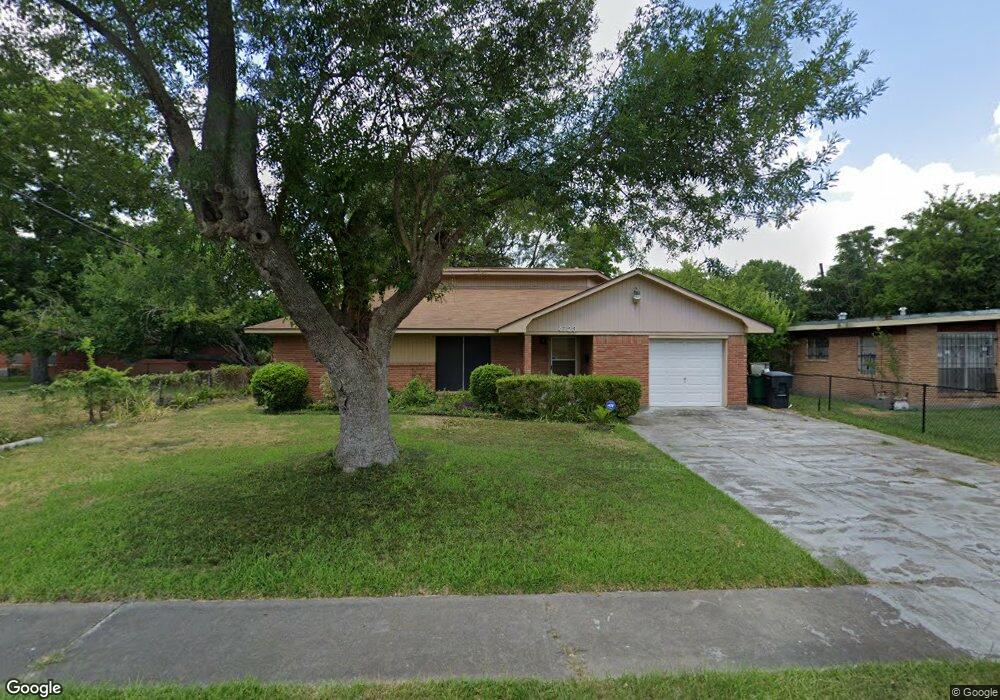
4723 Marable Dr Houston, TX 77022
Independence Heights NeighborhoodEstimated Value: $212,000 - $271,000
3
Beds
3
Baths
1,960
Sq Ft
$122/Sq Ft
Est. Value
About This Home
This home is located at 4723 Marable Dr, Houston, TX 77022 and is currently estimated at $239,337, approximately $122 per square foot. 4723 Marable Dr is a home located in Harris County with nearby schools including Kennedy Elementary School, Williams Middle, and Booker T Washington Sr High.
Ownership History
Date
Name
Owned For
Owner Type
Purchase Details
Closed on
Sep 20, 2021
Sold by
Carter Rosetta Taylor and Taylor Rosetta
Bought by
Carter Rosetta Taylor
Current Estimated Value
Home Financials for this Owner
Home Financials are based on the most recent Mortgage that was taken out on this home.
Original Mortgage
$255,000
Outstanding Balance
$250,134
Interest Rate
2.08%
Mortgage Type
Reverse Mortgage Home Equity Conversion Mortgage
Estimated Equity
-$10,797
Purchase Details
Closed on
Apr 3, 2003
Sold by
Ivy Bernice Alee
Bought by
Solis Pedro and Solis Maria R
Create a Home Valuation Report for This Property
The Home Valuation Report is an in-depth analysis detailing your home's value as well as a comparison with similar homes in the area
Home Values in the Area
Average Home Value in this Area
Purchase History
| Date | Buyer | Sale Price | Title Company |
|---|---|---|---|
| Carter Rosetta Taylor | -- | None Available | |
| Solis Pedro | -- | Fidelity National Title |
Source: Public Records
Mortgage History
| Date | Status | Borrower | Loan Amount |
|---|---|---|---|
| Open | Carter Rosetta Taylor | $255,000 |
Source: Public Records
Tax History Compared to Growth
Tax History
| Year | Tax Paid | Tax Assessment Tax Assessment Total Assessment is a certain percentage of the fair market value that is determined by local assessors to be the total taxable value of land and additions on the property. | Land | Improvement |
|---|---|---|---|---|
| 2025 | $20 | $206,892 | $115,830 | $91,062 |
| 2024 | $20 | $221,145 | $115,830 | $105,315 |
| 2023 | $20 | $198,806 | $92,664 | $106,142 |
| 2022 | $4,020 | $182,581 | $92,664 | $89,917 |
| 2021 | $3,297 | $160,776 | $92,664 | $68,112 |
| 2020 | $3,114 | $138,038 | $46,332 | $91,706 |
| 2019 | $2,959 | $134,072 | $46,332 | $87,740 |
| 2018 | $89 | $108,331 | $27,027 | $81,304 |
| 2017 | $2,443 | $108,331 | $27,027 | $81,304 |
| 2016 | $2,221 | $108,331 | $19,305 | $89,026 |
| 2015 | $208 | $86,625 | $19,305 | $67,320 |
| 2014 | $208 | $72,789 | $19,305 | $53,484 |
Source: Public Records
Map
Nearby Homes
- 510 Victoria Dr
- 627 Glenburnie Dr
- 5035 North Fwy
- 4440 Castor St
- 600 E Whitney St
- 0 Victoria Unit 54691087
- 312 Walthall Dr
- 330 Spell St
- 423 Gammon Dr
- 310 Walthall Dr
- 315 E Whitney St
- 4311 Busiek St
- Cypress Plan at Wellford Village
- Willow Plan at Wellford Village
- 4309 Delhi St
- 4305 Castor St
- 4303 Castor Na St
- 4402 Airline Dr
- 4303 Cadmus St
- 4311 Europa St