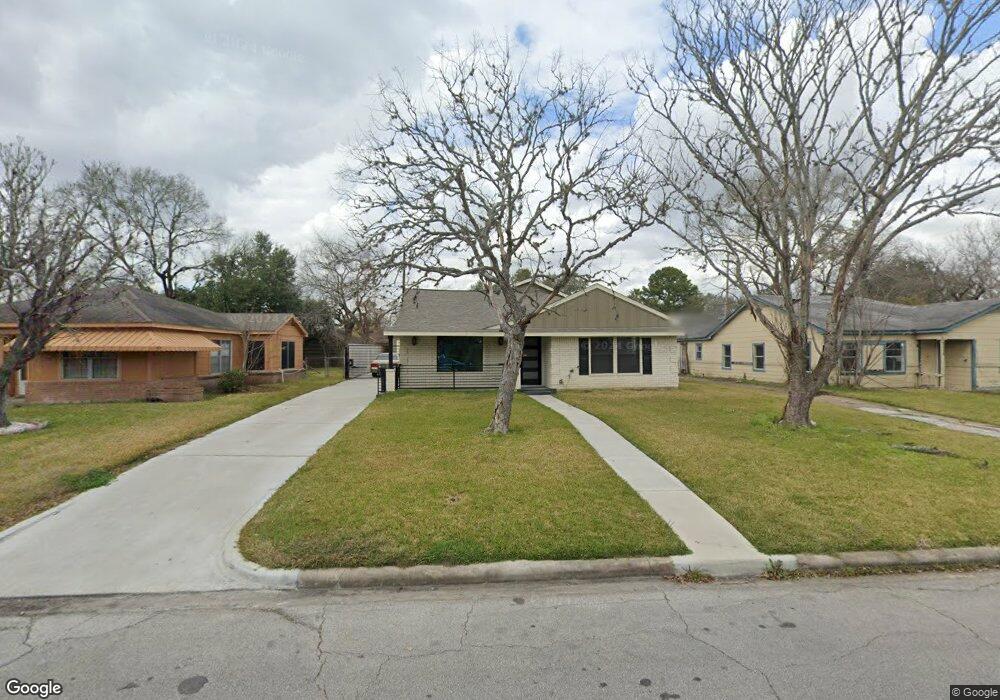
4723 Marietta Ln Houston, TX 77021
OST-South Union NeighborhoodEstimated Value: $261,000 - $352,000
4
Beds
2
Baths
1,912
Sq Ft
$160/Sq Ft
Est. Value
About This Home
This home is located at 4723 Marietta Ln, Houston, TX 77021 and is currently estimated at $305,180, approximately $159 per square foot. 4723 Marietta Ln is a home located in Harris County with nearby schools including Peck Elementary School, Cullen Middle School, and Yates High School.
Ownership History
Date
Name
Owned For
Owner Type
Purchase Details
Closed on
Apr 30, 2025
Sold by
Inner City Builders And Developers Llc
Bought by
Thompson Nigel Creg
Current Estimated Value
Purchase Details
Closed on
Jan 20, 2023
Sold by
Thompson Creg
Bought by
Inner City Builders Llc
Purchase Details
Closed on
Apr 4, 2022
Sold by
Inner City Builders And Developers Llc
Bought by
Thompson Creg
Purchase Details
Closed on
Aug 17, 2021
Sold by
Thompson Creg
Bought by
Inner City Builders And Developers Llc
Purchase Details
Closed on
Feb 27, 2020
Sold by
Inner City Builders And Developers Llc
Bought by
Thompson Creg
Purchase Details
Closed on
May 17, 2019
Sold by
Savers Investments Inc
Bought by
Inner City Builders And Developers Llc
Purchase Details
Closed on
May 16, 2019
Sold by
Ollison Bessie
Bought by
Savers Investments Inc
Purchase Details
Closed on
Jan 6, 1995
Sold by
Ollison Bessie Jewel and Ollison Aaron Louis
Bought by
Ollison Samuel George
Create a Home Valuation Report for This Property
The Home Valuation Report is an in-depth analysis detailing your home's value as well as a comparison with similar homes in the area
Home Values in the Area
Average Home Value in this Area
Purchase History
| Date | Buyer | Sale Price | Title Company |
|---|---|---|---|
| Thompson Nigel Creg | -- | None Listed On Document | |
| Inner City Builders Llc | -- | -- | |
| Thompson Creg | -- | None Listed On Document | |
| Inner City Builders And Developers Llc | -- | None Available | |
| Thompson Creg | -- | None Available | |
| Inner City Builders And Developers Llc | -- | None Available | |
| Savers Investments Inc | -- | Metropolitan Escrow & Title | |
| Ollison Samuel George | -- | -- |
Source: Public Records
Mortgage History
| Date | Status | Borrower | Loan Amount |
|---|---|---|---|
| Closed | Inner City Builders And Developers Llc | $0 |
Source: Public Records
Tax History Compared to Growth
Tax History
| Year | Tax Paid | Tax Assessment Tax Assessment Total Assessment is a certain percentage of the fair market value that is determined by local assessors to be the total taxable value of land and additions on the property. | Land | Improvement |
|---|---|---|---|---|
| 2025 | $6,551 | $313,092 | $127,125 | $185,967 |
| 2024 | $6,551 | $313,092 | $127,125 | $185,967 |
| 2023 | $6,551 | $277,303 | $127,125 | $150,178 |
| 2022 | $6,509 | $280,921 | $113,000 | $167,921 |
| 2021 | $6,060 | $260,000 | $98,875 | $161,125 |
| 2020 | $4,406 | $173,700 | $70,625 | $103,075 |
| 2019 | $3,639 | $166,664 | $63,563 | $103,101 |
| 2018 | $0 | $151,441 | $55,219 | $96,222 |
| 2017 | $3,005 | $125,880 | $42,750 | $83,130 |
| 2016 | $2,732 | $103,352 | $33,844 | $69,508 |
| 2015 | -- | $98,541 | $33,844 | $64,697 |
| 2014 | -- | $90,651 | $33,844 | $56,807 |
Source: Public Records
Map
Nearby Homes
- 4735 Marietta Ln
- 4711 Marietta Ln
- 4826 Culmore Dr
- 4918 Culmore Dr
- 4807 Eppes St
- 4826 Ventura Ln
- 4914 Gammage St
- 4838 Marietta Ln
- 4930 Culmore Dr
- 4435 Old Spanish Trail
- 4850 Marietta Ln
- 4902 Marietta Ln
- 4910 Eppes St
- 3917, 3919 Griggs Rd
- 5610 Milart St
- 4327 Alconbury Ln
- 4923 Winnetka St
- 5822 Grace Ln
- 4928 Old Spanish Trail
- 5831 Grace Ln
- 4719 Marietta Ln
- 4727 Marietta Ln
- 4715 Marietta Ln
- 4718 Arvilla Ln
- 4714 Arvilla Ln
- 4722 Arvilla Ln
- 4710 Arvilla Ln
- 4722 Marietta Ln
- 4726 Marietta Ln
- 4718 Marietta Ln
- 4726 Arvilla Ln
- 4706 Arvilla Ln
- 4730 Marietta Ln
- 4707 Marietta Ln
- 4739 Marietta Ln
- 4714 Marietta Ln
- 4734 Marietta Ln
- 4730 Arvilla Ln
- 4702 Arvilla Ln
- 4807 Culmore Dr