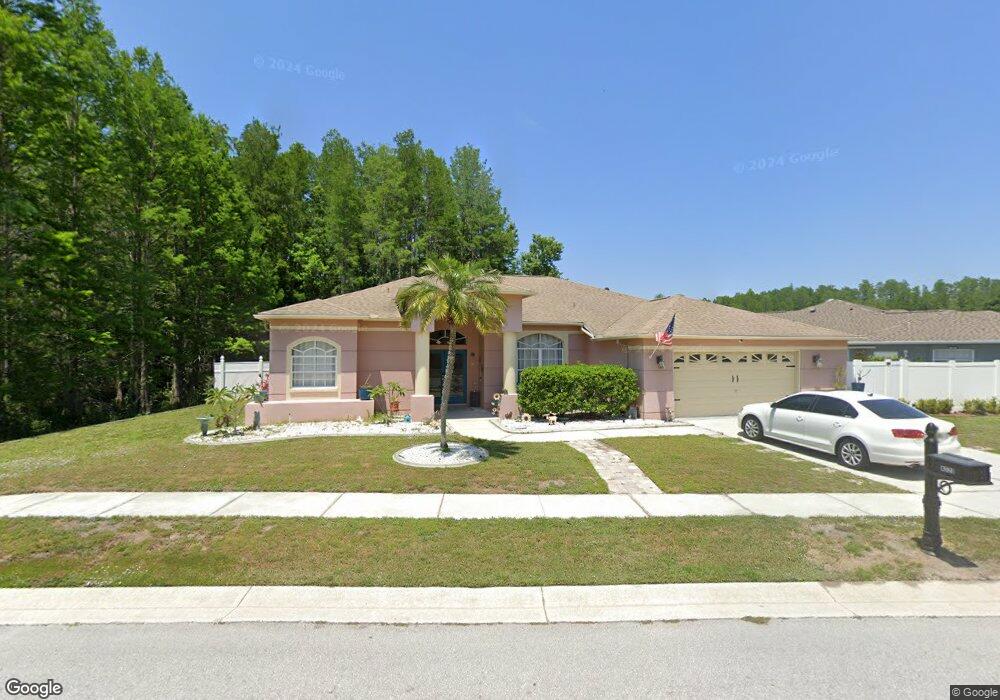
4723 Spring Side Dr New Port Richey, FL 34653
Seven Springs NeighborhoodEstimated Value: $408,928 - $439,000
3
Beds
2
Baths
3,017
Sq Ft
$141/Sq Ft
Est. Value
About This Home
This home is located at 4723 Spring Side Dr, New Port Richey, FL 34653 and is currently estimated at $424,232, approximately $140 per square foot. 4723 Spring Side Dr is a home located in Pasco County with nearby schools including Deer Park Elementary School, River Ridge High School, and River Ridge Middle School.
Ownership History
Date
Name
Owned For
Owner Type
Purchase Details
Closed on
Jul 22, 2024
Sold by
Walden Kristen L and Freitas Kristen L
Bought by
Freitas Kristen L
Current Estimated Value
Home Financials for this Owner
Home Financials are based on the most recent Mortgage that was taken out on this home.
Original Mortgage
$278,082
Outstanding Balance
$274,735
Interest Rate
6.95%
Mortgage Type
FHA
Estimated Equity
$149,497
Purchase Details
Closed on
May 2, 2016
Sold by
Bomay Mary E
Bought by
Walden Kristen L
Home Financials for this Owner
Home Financials are based on the most recent Mortgage that was taken out on this home.
Original Mortgage
$185,250
Interest Rate
3.71%
Mortgage Type
New Conventional
Purchase Details
Closed on
May 13, 2008
Sold by
Bomay Richard L and Bomay Mary E
Bought by
The Richard L & Mary E Bomay Revocable T
Purchase Details
Closed on
Dec 5, 1996
Sold by
Grove Park Homes Inc
Bought by
Bomay Richard L and Bomay Mary E
Create a Home Valuation Report for This Property
The Home Valuation Report is an in-depth analysis detailing your home's value as well as a comparison with similar homes in the area
Home Values in the Area
Average Home Value in this Area
Purchase History
| Date | Buyer | Sale Price | Title Company |
|---|---|---|---|
| Freitas Kristen L | -- | None Listed On Document | |
| Walden Kristen L | $195,000 | None Available | |
| The Richard L & Mary E Bomay Revocable T | -- | None Available | |
| Bomay Richard L | $124,500 | -- |
Source: Public Records
Mortgage History
| Date | Status | Borrower | Loan Amount |
|---|---|---|---|
| Open | Freitas Kristen L | $278,082 | |
| Previous Owner | Walden Kristen L | $185,250 |
Source: Public Records
Tax History Compared to Growth
Tax History
| Year | Tax Paid | Tax Assessment Tax Assessment Total Assessment is a certain percentage of the fair market value that is determined by local assessors to be the total taxable value of land and additions on the property. | Land | Improvement |
|---|---|---|---|---|
| 2025 | $3,383 | $231,620 | -- | -- |
| 2024 | $3,383 | $225,100 | -- | -- |
| 2023 | $3,256 | $218,550 | $0 | $0 |
| 2022 | $2,926 | $212,190 | $0 | $0 |
| 2021 | $2,869 | $206,010 | $34,303 | $171,707 |
| 2020 | $2,822 | $203,170 | $25,416 | $177,754 |
| 2019 | $2,772 | $198,604 | $25,416 | $173,188 |
| 2018 | $2,751 | $196,884 | $0 | $0 |
| 2017 | $2,737 | $192,834 | $25,416 | $167,418 |
| 2016 | $1,746 | $133,729 | $0 | $0 |
| 2015 | $1,768 | $132,799 | $0 | $0 |
| 2014 | $1,718 | $151,458 | $22,216 | $129,242 |
Source: Public Records
Map
Nearby Homes
- 4622 Whitetail Ln
- 8450 Royal Hart Dr
- 4611 Addax Dr
- 4339 Riverwood Dr
- 4728 Swallowtail Dr
- 4350 Sawgrass Blvd
- 4652 Swallowtail Dr
- 8110 Damara Dr
- 4519 Swallowtail Dr
- 4306 Riverwood Dr
- 4371 Otter Way
- 4244 Raccoon Loop
- 8448 Red Roe Dr
- 4236 Riverwood Dr
- 5221 Spike Horn Dr
- 8041 Blue Finch Way
- 9032 Arundle Place
- 8346 Shallow Creek Ct
- 4916 Troon Ln
- 4142 Sawgrass Blvd
- 4731 Spring Side Dr
- 4720 Spring Side Dr
- 4739 Spring Side Dr
- 4716 Spring Side Dr
- 4726 Spring Side Dr
- 4730 Spring Side Dr
- 4710 Spring Side Dr
- 4734 Spring Side Dr
- 4751 Spring Side Dr
- 8450 Siamang Ct
- 4740 Spring Side Dr
- 8446 Siamang Ct
- 4702 Spring Side Dr
- 8504 Siamang Ct
- 4805 Spring Side Dr
- 8508 Siamang Ct
- 4648 Spring Side Dr
- 4748 Spring Side Dr
- 8512 Siamang Ct
- 8442 Siamang Ct