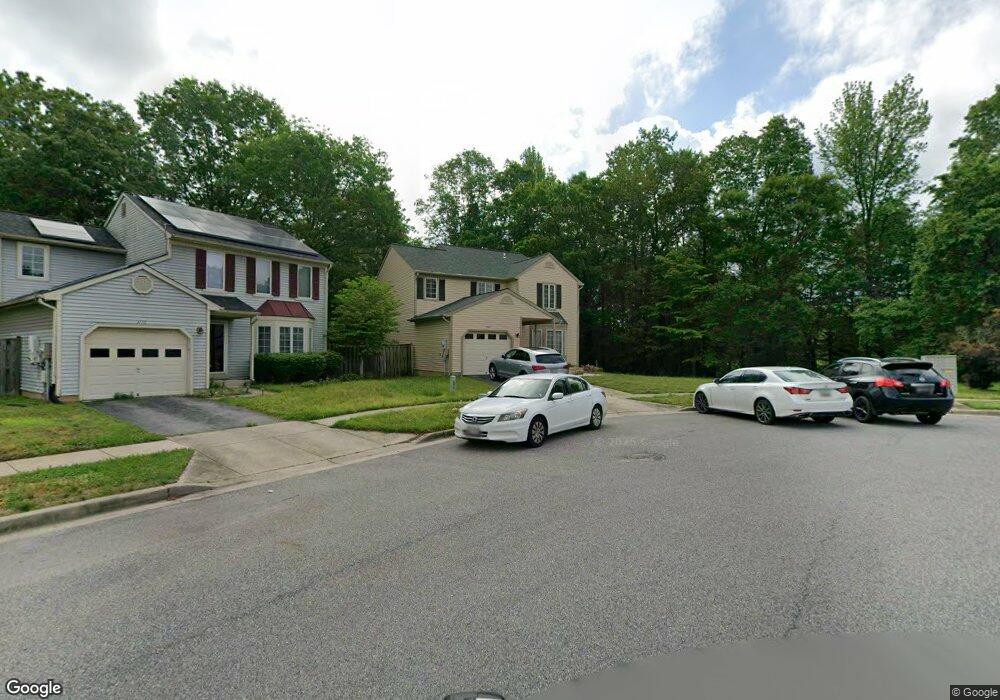
4724 Colonel Darnell Place Upper Marlboro, MD 20772
Estimated Value: $465,000 - $560,000
4
Beds
4
Baths
3,788
Sq Ft
$136/Sq Ft
Est. Value
About This Home
This home is located at 4724 Colonel Darnell Place, Upper Marlboro, MD 20772 and is currently estimated at $516,221, approximately $136 per square foot. 4724 Colonel Darnell Place is a home located in Prince George's County with nearby schools including Barack Obama Elementary School, James Madison Middle School, and Dr. Henry A. Wise Jr. High School.
Ownership History
Date
Name
Owned For
Owner Type
Purchase Details
Closed on
Feb 18, 2010
Sold by
Parker Cheryl E
Bought by
Ningpa Tiwang H
Current Estimated Value
Home Financials for this Owner
Home Financials are based on the most recent Mortgage that was taken out on this home.
Original Mortgage
$251,505
Outstanding Balance
$167,202
Interest Rate
5.12%
Mortgage Type
FHA
Estimated Equity
$349,019
Purchase Details
Closed on
Jun 28, 2005
Sold by
Ray David C
Bought by
Parker Cheryl E
Home Financials for this Owner
Home Financials are based on the most recent Mortgage that was taken out on this home.
Original Mortgage
$73,500
Interest Rate
6.05%
Mortgage Type
Credit Line Revolving
Purchase Details
Closed on
Apr 26, 2005
Sold by
Ray David C
Bought by
Parker Cheryl E
Home Financials for this Owner
Home Financials are based on the most recent Mortgage that was taken out on this home.
Original Mortgage
$73,500
Interest Rate
6.05%
Mortgage Type
Credit Line Revolving
Purchase Details
Closed on
Jul 9, 2003
Sold by
Johnson Jackie W
Bought by
Ray David C and Ray Angela Y
Purchase Details
Closed on
Nov 5, 1999
Sold by
Adams Robert R
Bought by
Johnson Jackie W and Johnson Steve J
Create a Home Valuation Report for This Property
The Home Valuation Report is an in-depth analysis detailing your home's value as well as a comparison with similar homes in the area
Home Values in the Area
Average Home Value in this Area
Purchase History
| Date | Buyer | Sale Price | Title Company |
|---|---|---|---|
| Ningpa Tiwang H | $256,145 | -- | |
| Parker Cheryl E | $367,500 | -- | |
| Parker Cheryl E | $367,500 | -- | |
| Ray David C | $260,000 | -- | |
| Johnson Jackie W | $176,000 | -- |
Source: Public Records
Mortgage History
| Date | Status | Borrower | Loan Amount |
|---|---|---|---|
| Open | Ningpa Tiwang H | $251,505 | |
| Previous Owner | Parker Cheryl E | $73,500 | |
| Previous Owner | Parker Cheryl E | $73,500 |
Source: Public Records
Tax History Compared to Growth
Tax History
| Year | Tax Paid | Tax Assessment Tax Assessment Total Assessment is a certain percentage of the fair market value that is determined by local assessors to be the total taxable value of land and additions on the property. | Land | Improvement |
|---|---|---|---|---|
| 2025 | $5,661 | $461,400 | $110,100 | $351,300 |
| 2024 | $5,661 | $433,433 | $0 | $0 |
| 2023 | $5,432 | $405,467 | $0 | $0 |
| 2022 | $5,150 | $377,500 | $100,100 | $277,400 |
| 2021 | $4,909 | $356,700 | $0 | $0 |
| 2020 | $4,781 | $335,900 | $0 | $0 |
| 2019 | $4,626 | $315,100 | $75,000 | $240,100 |
| 2018 | $4,482 | $301,767 | $0 | $0 |
| 2017 | $4,366 | $288,433 | $0 | $0 |
| 2016 | -- | $275,100 | $0 | $0 |
| 2015 | $4,234 | $265,067 | $0 | $0 |
| 2014 | $4,234 | $255,033 | $0 | $0 |
Source: Public Records
Map
Nearby Homes
- 4720 Colonel Ashton Place
- 4808 Colonel Brooke Ct
- 14412 Marlborough Dr
- 14416 Colonel Fenwick Ct
- 14404 Marlborough Dr
- 14511 Marlborough Cir
- 14218 Hampshire Hall Ct
- 4411 Largo Rd
- 14257 Hampshire Hall Ct
- 4638 Governor Kent Ct
- 4603 Governor Kent Ct
- 14100 Old Marlboro Pike
- 14100 Farnsworth Ln Unit 2108
- 15109 Marlboro Pike
- 5431 Old Crain Hwy
- 13817 Churchville Dr
- 15200 Peerless Ave
- 4315 Reverend Eversfield Ct
- 4707 King John Way
- 13900 King George Way
- 4722 Colonel Darnell Place
- 4720 Colonel Darnell Place
- 4721 Colonel Darnell Place
- 4718 Colonel Darnell Place
- 4719 Colonel Darnell Place
- 4715 Colonel Darnell Place
- 4717 Colonel Darnell Place
- 4716 Colonel Darnell Place
- 4713 Colonel Darnell Place
- 4930 Colonel Contee Place
- 4711 Colonel Darnell Place
- 4714 Colonel Darnell Place
- 4932 Colonel Contee Place
- 14507 Colonel Contee Ct
- 14509 Colonel Contee Ct
- 4709 Colonel Darnell Place
- 4712 Colonel Darnell Place
- 4934 Colonel Contee Place
- 4926 Colonel Contee Place
- 14511 Colonel Contee Ct