Estimated Value: $365,000 - $433,000
4
Beds
2
Baths
1,870
Sq Ft
$214/Sq Ft
Est. Value
About This Home
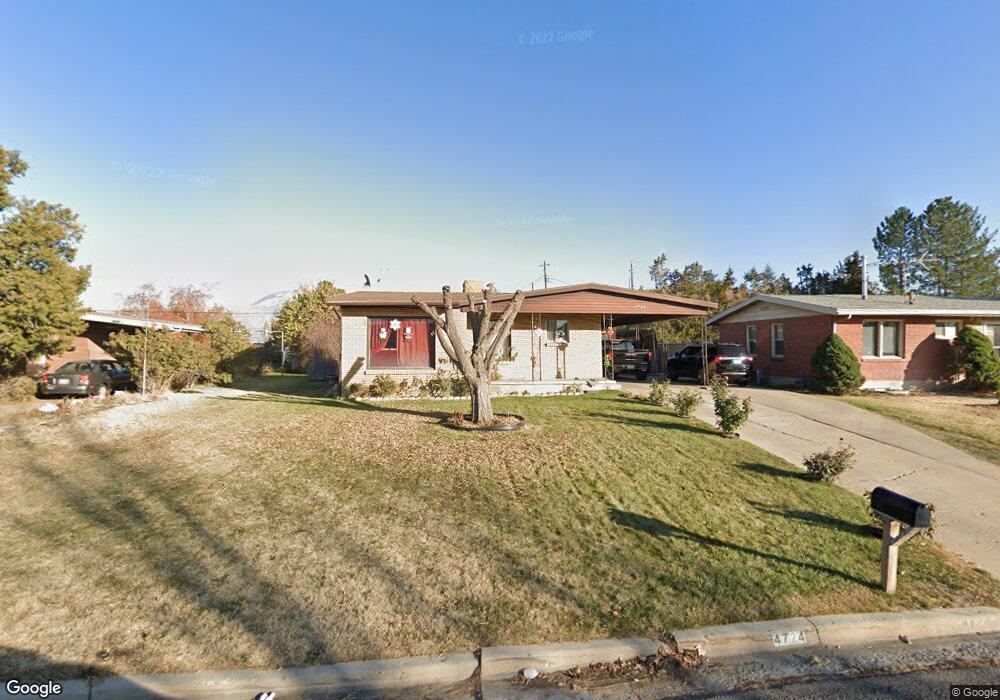
This home is located at 4724 S 2025 W, Roy, UT 84067 and is currently estimated at $399,290, approximately $213 per square foot. 4724 S 2025 W is a home located in Weber County with nearby schools including North Park School, Sand Ridge Junior High School, and Roy High School.
Ownership History
Date
Name
Owned For
Owner Type
Purchase Details
Closed on
Sep 24, 2020
Sold by
Zendejas Otillo
Bought by
Zendjas Otillo and Cervantes Norma
Current Estimated Value
Purchase Details
Closed on
Jun 14, 2018
Sold by
Polina Maria Eridany and Polina Jose Angel
Bought by
Zendejas Otilo
Home Financials for this Owner
Home Financials are based on the most recent Mortgage that was taken out on this home.
Original Mortgage
$213,750
Interest Rate
4.5%
Mortgage Type
New Conventional
Purchase Details
Closed on
Dec 21, 2015
Sold by
Leff Brandon
Bought by
Polina Maria Eridany and Polina Jose Angel
Home Financials for this Owner
Home Financials are based on the most recent Mortgage that was taken out on this home.
Original Mortgage
$7,730
Interest Rate
4.25%
Mortgage Type
FHA
Create a Home Valuation Report for This Property
The Home Valuation Report is an in-depth analysis detailing your home's value as well as a comparison with similar homes in the area
Home Values in the Area
Average Home Value in this Area
Purchase History
| Date | Buyer | Sale Price | Title Company |
|---|---|---|---|
| Zendjas Otillo | -- | None Available | |
| Zendejas Otilo | -- | Inwest Title Services Inc | |
| Polina Maria Eridany | -- | Hickman Land Title Co |
Source: Public Records
Mortgage History
| Date | Status | Borrower | Loan Amount |
|---|---|---|---|
| Previous Owner | Zendejas Otilo | $213,750 | |
| Previous Owner | Polina Maria Eridany | $7,730 |
Source: Public Records
Tax History Compared to Growth
Tax History
| Year | Tax Paid | Tax Assessment Tax Assessment Total Assessment is a certain percentage of the fair market value that is determined by local assessors to be the total taxable value of land and additions on the property. | Land | Improvement |
|---|---|---|---|---|
| 2025 | $2,293 | $357,799 | $120,000 | $237,799 |
| 2024 | $2,240 | $193,599 | $66,000 | $127,599 |
| 2023 | $2,161 | $187,000 | $63,153 | $123,847 |
| 2022 | $2,026 | $179,300 | $57,754 | $121,546 |
| 2021 | $1,750 | $255,000 | $13,440 | $241,560 |
| 2020 | $1,716 | $231,000 | $13,440 | $217,560 |
| 2019 | $1,610 | $203,000 | $40,016 | $162,984 |
| 2018 | $1,515 | $179,000 | $34,964 | $144,036 |
| 2017 | $1,384 | $152,000 | $33,078 | $118,922 |
| 2016 | $1,301 | $76,451 | $19,520 | $56,931 |
| 2015 | $1,079 | $62,877 | $19,520 | $43,357 |
| 2014 | $1,066 | $61,715 | $19,520 | $42,195 |
Source: Public Records
Map
Nearby Homes
- 2038 W 4600 S
- 2067 W 4750 S
- 2107 W 4750 S
- 4642 S 1900 W Unit 41
- 4848 S 2125 W
- 4475 S 1975 W
- 2153 W 4800 S
- 4536 S 1900 W Unit 12
- 4602 Hathaway Dr
- 1825 W 4500 S Unit 101
- 2259 W 4525 S
- 2082 W 4450 S
- 1766 W 4575 S
- 4593 Promenade Dr
- 5006 S 1800 W
- 1789 W 5000 S
- 1825 W 4400 S
- 2179 W 4975 S
- 2263 W 4400 S
- 4502 S 1720 W