Estimated Value: $371,163 - $394,000
4
Beds
2
Baths
1,482
Sq Ft
$258/Sq Ft
Est. Value
About This Home
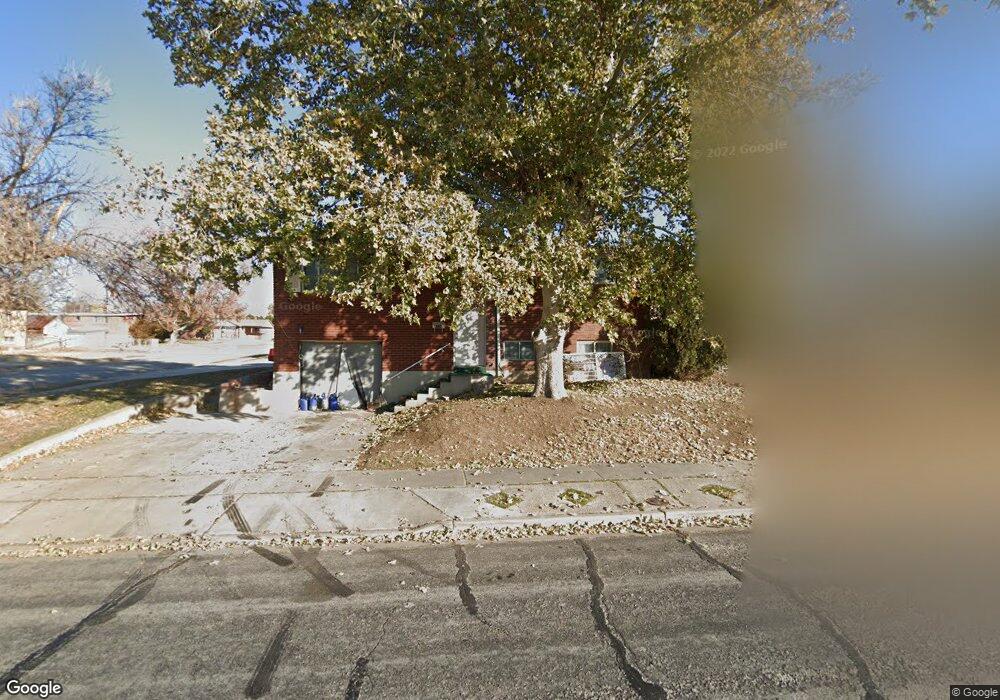
This home is located at 4724 S 2575 W, Roy, UT 84067 and is currently estimated at $382,041, approximately $257 per square foot. 4724 S 2575 W is a home located in Weber County with nearby schools including Valley View School, Sand Ridge Junior High School, and Roy High School.
Ownership History
Date
Name
Owned For
Owner Type
Purchase Details
Closed on
Aug 11, 2009
Sold by
Federal National Mortgage Association
Bought by
Shipley Brandy
Current Estimated Value
Home Financials for this Owner
Home Financials are based on the most recent Mortgage that was taken out on this home.
Original Mortgage
$105,061
Outstanding Balance
$69,057
Interest Rate
5.37%
Mortgage Type
FHA
Estimated Equity
$312,984
Purchase Details
Closed on
Apr 9, 2009
Sold by
Tolman Brody M
Bought by
Federal National Mortgage Association
Purchase Details
Closed on
Apr 19, 2007
Sold by
Meierhoff Dayla R
Bought by
Tolman Brody M
Home Financials for this Owner
Home Financials are based on the most recent Mortgage that was taken out on this home.
Original Mortgage
$145,400
Interest Rate
6.1%
Mortgage Type
Purchase Money Mortgage
Purchase Details
Closed on
May 21, 2003
Sold by
Meierhoff Dayla R and Meierhoff Christopher D
Bought by
Meierhoff Dayla R
Purchase Details
Closed on
Jan 9, 2002
Sold by
Grow Norman G and Grow Midge
Bought by
Melerhoff Christopher D and Melerhoff Dayla R
Home Financials for this Owner
Home Financials are based on the most recent Mortgage that was taken out on this home.
Original Mortgage
$116,790
Interest Rate
7.01%
Mortgage Type
VA
Create a Home Valuation Report for This Property
The Home Valuation Report is an in-depth analysis detailing your home's value as well as a comparison with similar homes in the area
Home Values in the Area
Average Home Value in this Area
Purchase History
| Date | Buyer | Sale Price | Title Company |
|---|---|---|---|
| Shipley Brandy | $107,000 | Us Title Insurance Agency | |
| Federal National Mortgage Association | $126,880 | None Available | |
| Tolman Brody M | -- | Founders Title Company Syrac | |
| Meierhoff Dayla R | -- | -- | |
| Melerhoff Christopher D | -- | -- |
Source: Public Records
Mortgage History
| Date | Status | Borrower | Loan Amount |
|---|---|---|---|
| Open | Shipley Brandy | $105,061 | |
| Previous Owner | Tolman Brody M | $145,400 | |
| Previous Owner | Melerhoff Christopher D | $116,790 |
Source: Public Records
Tax History
| Year | Tax Paid | Tax Assessment Tax Assessment Total Assessment is a certain percentage of the fair market value that is determined by local assessors to be the total taxable value of land and additions on the property. | Land | Improvement |
|---|---|---|---|---|
| 2025 | $2,172 | $336,309 | $118,613 | $217,696 |
| 2024 | $2,122 | $182,049 | $65,237 | $116,812 |
| 2023 | $1,942 | $165,550 | $62,578 | $102,972 |
| 2022 | $2,197 | $196,350 | $54,616 | $141,734 |
| 2021 | $1,677 | $243,000 | $69,329 | $173,671 |
| 2020 | $1,577 | $210,000 | $69,329 | $140,671 |
| 2019 | $1,631 | $206,000 | $39,500 | $166,500 |
| 2018 | $1,581 | $188,000 | $35,560 | $152,440 |
| 2017 | $1,439 | $159,000 | $35,560 | $123,440 |
| 2016 | $1,334 | $78,693 | $18,871 | $59,822 |
| 2015 | $1,203 | $71,984 | $18,871 | $53,113 |
| 2014 | $1,207 | $71,611 | $16,015 | $55,596 |
Source: Public Records
Map
Nearby Homes
Your Personal Tour Guide
Ask me questions while you tour the home.