Estimated Value: $373,000 - $404,000
4
Beds
2
Baths
2,120
Sq Ft
$184/Sq Ft
Est. Value
About This Home
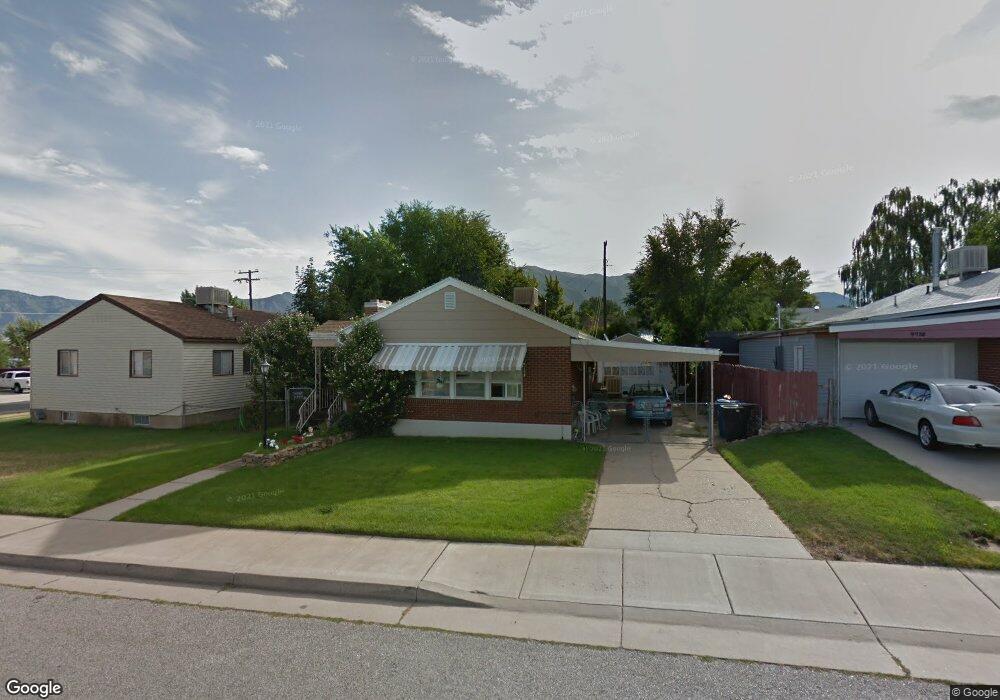
This home is located at 4724 S 275 W, Ogden, UT 84405 and is currently estimated at $390,617, approximately $184 per square foot. 4724 S 275 W is a home located in Weber County with nearby schools including Washington Terrace School, T.H. Bell Junior High School, and Bonneville High School.
Ownership History
Date
Name
Owned For
Owner Type
Purchase Details
Closed on
Jan 22, 2018
Sold by
Lloyd Kyler James
Bought by
Sarvello Jaedn and Sarvello Chardonnay
Current Estimated Value
Home Financials for this Owner
Home Financials are based on the most recent Mortgage that was taken out on this home.
Original Mortgage
$210,429
Outstanding Balance
$177,532
Interest Rate
3.93%
Mortgage Type
VA
Estimated Equity
$213,085
Purchase Details
Closed on
Mar 20, 2007
Sold by
Kreptan Ltd Co
Bought by
Hadley Brent E and Hadley Carol I
Purchase Details
Closed on
Aug 11, 2005
Sold by
Perkins Michael
Bought by
Kreptan Lc
Purchase Details
Closed on
Dec 18, 2001
Sold by
Morris M Wayne and Morris Marcelle F
Bought by
Perkins Michael
Home Financials for this Owner
Home Financials are based on the most recent Mortgage that was taken out on this home.
Original Mortgage
$109,900
Interest Rate
6.39%
Mortgage Type
Seller Take Back
Create a Home Valuation Report for This Property
The Home Valuation Report is an in-depth analysis detailing your home's value as well as a comparison with similar homes in the area
Home Values in the Area
Average Home Value in this Area
Purchase History
We collect this data history from publicly available records. To have your information removed, we recommend requesting removal directly through your county’s website.
| Date | Buyer | Sale Price | Title Company |
|---|---|---|---|
| Sarvello Jaedn | -- | Security Title Of Davis Coun | |
| Hadley Brent E | -- | Weber Title | |
| Kreptan Lc | -- | -- | |
| Perkins Michael | -- | Equity Title |
Source: Public Records
Mortgage History
We collect this data history from publicly available records. To have your information removed, we recommend requesting removal directly through your county’s website.
| Date | Status | Borrower | Loan Amount |
|---|---|---|---|
| Open | Sarvello Jaedn | $210,429 | |
| Previous Owner | Perkins Michael | $109,900 |
Source: Public Records
Tax History
| Year | Tax Paid | Tax Assessment Tax Assessment Total Assessment is a certain percentage of the fair market value that is determined by local assessors to be the total taxable value of land and additions on the property. | Land | Improvement |
|---|---|---|---|---|
| 2025 | $2,600 | $386,288 | $107,501 | $278,787 |
| 2024 | $2,463 | $205,698 | $59,125 | $146,573 |
| 2023 | $2,346 | $195,249 | $59,557 | $135,692 |
| 2022 | $2,513 | $218,350 | $56,893 | $161,457 |
| 2021 | $2,065 | $291,001 | $53,731 | $237,270 |
| 2020 | $2,023 | $261,000 | $44,011 | $216,989 |
| 2019 | $1,939 | $231,001 | $44,011 | $186,990 |
| 2018 | $1,725 | $200,000 | $44,011 | $155,989 |
| 2017 | $1,503 | $160,000 | $29,020 | $130,980 |
| 2016 | $1,391 | $80,325 | $16,232 | $64,093 |
| 2015 | $1,355 | $76,404 | $16,232 | $60,172 |
| 2014 | $1,342 | $75,072 | $16,232 | $58,840 |
Source: Public Records
Map
Nearby Homes
Your Personal Tour Guide
Ask me questions while you tour the home.