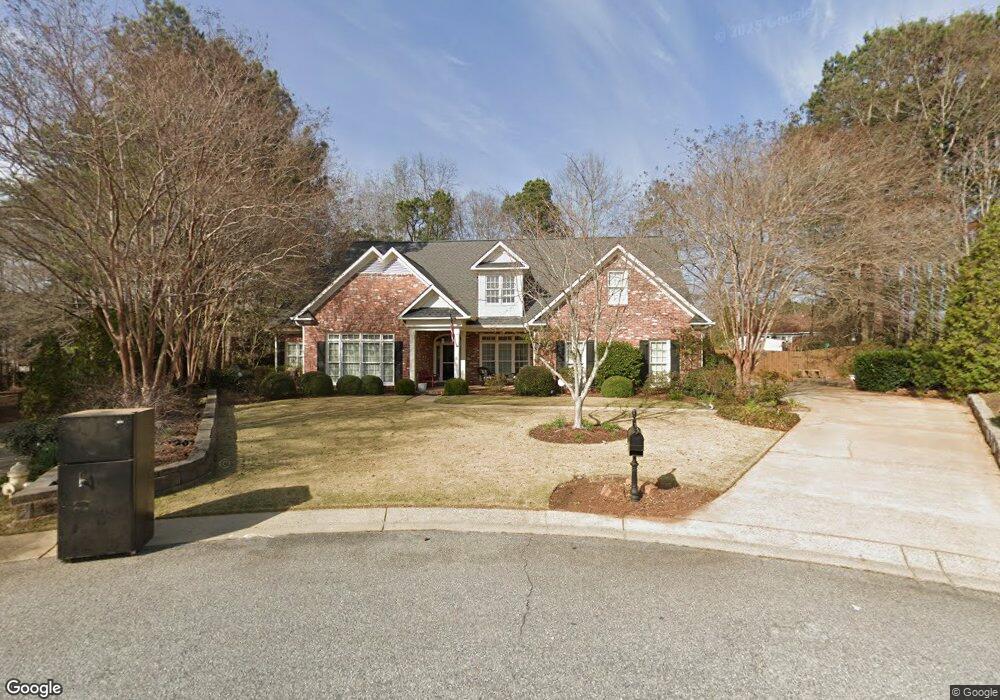
4725 Champions Way Columbus, GA 31909
Northern Columbus NeighborhoodEstimated Value: $482,000 - $504,201
4
Beds
4
Baths
3,093
Sq Ft
$159/Sq Ft
Est. Value
About This Home
This home is located at 4725 Champions Way, Columbus, GA 31909 and is currently estimated at $490,800, approximately $158 per square foot. 4725 Champions Way is a home located in Muscogee County with nearby schools including Eagle Ridge Academy, Blackmon Road Middle School, and Shaw High School.
Ownership History
Date
Name
Owned For
Owner Type
Purchase Details
Closed on
May 18, 2022
Sold by
Scuba John R
Bought by
Dehenning Michael and Dehenning Missy S
Current Estimated Value
Home Financials for this Owner
Home Financials are based on the most recent Mortgage that was taken out on this home.
Original Mortgage
$340,000
Outstanding Balance
$323,137
Interest Rate
5.3%
Mortgage Type
New Conventional
Estimated Equity
$167,663
Purchase Details
Closed on
Sep 29, 2009
Sold by
Scuba John R
Bought by
Scuba John and Scuba Lynn Marie
Home Financials for this Owner
Home Financials are based on the most recent Mortgage that was taken out on this home.
Original Mortgage
$201,500
Interest Rate
4.48%
Mortgage Type
VA
Create a Home Valuation Report for This Property
The Home Valuation Report is an in-depth analysis detailing your home's value as well as a comparison with similar homes in the area
Home Values in the Area
Average Home Value in this Area
Purchase History
| Date | Buyer | Sale Price | Title Company |
|---|---|---|---|
| Dehenning Michael | $425,000 | Meacham & Earley Pc | |
| Scuba John | -- | Transtar National Title |
Source: Public Records
Mortgage History
| Date | Status | Borrower | Loan Amount |
|---|---|---|---|
| Open | Dehenning Michael | $340,000 | |
| Previous Owner | Scuba John | $201,500 |
Source: Public Records
Tax History Compared to Growth
Tax History
| Year | Tax Paid | Tax Assessment Tax Assessment Total Assessment is a certain percentage of the fair market value that is determined by local assessors to be the total taxable value of land and additions on the property. | Land | Improvement |
|---|---|---|---|---|
| 2025 | $613 | $187,680 | $29,324 | $158,356 |
| 2024 | $7,592 | $187,680 | $29,324 | $158,356 |
| 2023 | $4,247 | $169,872 | $29,324 | $140,548 |
| 2022 | $5,116 | $138,644 | $29,324 | $109,320 |
| 2021 | $5,109 | $138,512 | $29,324 | $109,188 |
| 2020 | $5,110 | $138,512 | $29,324 | $109,188 |
| 2019 | $5,675 | $138,512 | $29,324 | $109,188 |
| 2018 | $5,675 | $138,512 | $29,324 | $109,188 |
| 2017 | $5,693 | $138,512 | $29,324 | $109,188 |
| 2016 | $5,843 | $141,658 | $13,956 | $127,702 |
| 2015 | $5,850 | $141,658 | $13,956 | $127,702 |
| 2014 | $4,248 | $102,732 | $13,956 | $88,776 |
| 2013 | -- | $100,131 | $13,956 | $86,175 |
Source: Public Records
Map
Nearby Homes
- 4880 Turnberry Ln
- 7933 Prestwick Ct
- 4840 Spring Ridge Dr
- 4848 Spring Ridge Dr
- 4854 Champions Way
- 7847 Kolven Cove
- 4701 Turnberry Ln Unit 6
- 8507 Galena Rd
- 7807 Kolven Cove
- 8848 Promenade Place
- 8039 Adelaide Dr
- 4756 Timarron Loop
- 8000 Cooper Creek Rd
- 4691 Talamore Ln
- 8049 Cooper Creek Rd
- 2040 Old Guard Rd
- 7168 Pinewood Ct
- 4764 Bridlewood Dr
- 8082 Veterans Pkwy
- 4677 Ivy Patch Dr
- 4731 Champions Way
- 4892 Springwood Cir
- 4718 Champion's Way
- 4718 Champions Way
- 4886 Springwood Cir
- 4878 Springwood Cir
- 4898 Springwood Cir
- 4737 Champions Way
- 4724 Champions Way
- 4872 Springwood Cir
- 0 Springwood Cir
- 4866 Springwood Cir
- 4730 Champions Way
- 4904 Springwood Cir
- 4743 Champions Way
- 4862 Springwood Cir
- 4893 Springwood Cir
- 4611 Baltusrol Ct
- 4785 Winged Foot Way
- 4883 Springwood Cir