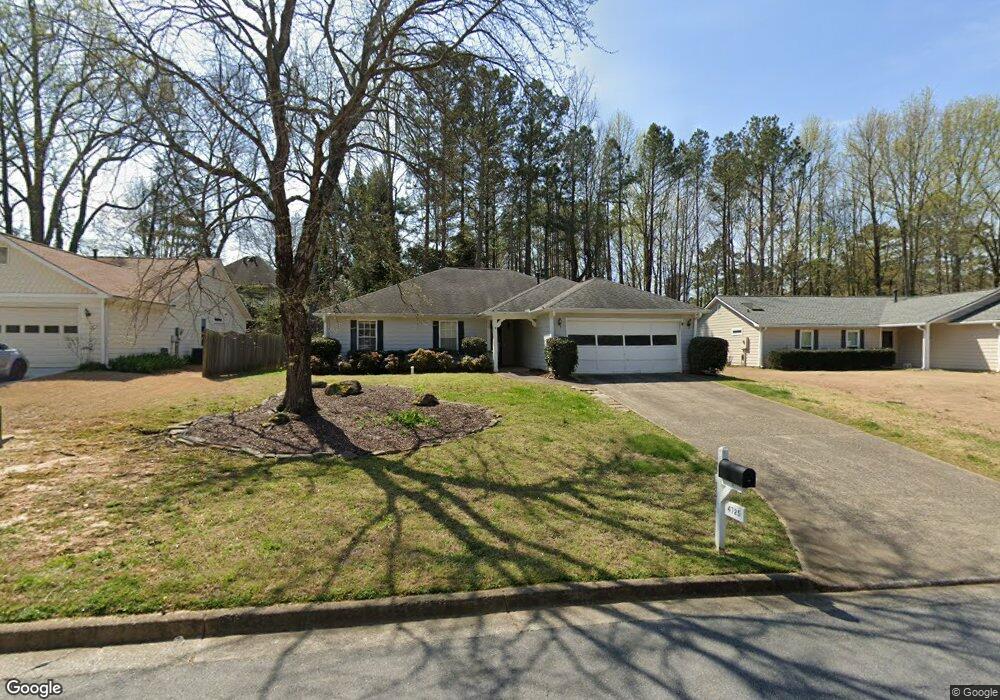
4725 Hanstedt Trace Alpharetta, GA 30022
Estimated Value: $403,000 - $496,000
3
Beds
2
Baths
1,584
Sq Ft
$294/Sq Ft
Est. Value
About This Home
This home is located at 4725 Hanstedt Trace, Alpharetta, GA 30022 and is currently estimated at $466,350, approximately $294 per square foot. 4725 Hanstedt Trace is a home located in Fulton County with nearby schools including Ocee Elementary School, Taylor Road Middle School, and Chattahoochee High School.
Ownership History
Date
Name
Owned For
Owner Type
Purchase Details
Closed on
May 20, 2011
Sold by
Lxs 2006-11
Bought by
Yang Ying
Current Estimated Value
Home Financials for this Owner
Home Financials are based on the most recent Mortgage that was taken out on this home.
Original Mortgage
$99,000
Outstanding Balance
$68,800
Interest Rate
4.88%
Mortgage Type
New Conventional
Estimated Equity
$397,550
Purchase Details
Closed on
Oct 5, 2010
Sold by
George Kevin R and George Christopher R
Bought by
Bank Of America Na Lxs 2006-11
Purchase Details
Closed on
Aug 9, 1995
Sold by
Bahler Elizabeth J
Bought by
Bailey Leah Jill
Purchase Details
Closed on
Jul 14, 1993
Sold by
Helms John H Barbara
Bought by
Bahler Elizabeth J
Home Financials for this Owner
Home Financials are based on the most recent Mortgage that was taken out on this home.
Original Mortgage
$35,000
Interest Rate
7.49%
Create a Home Valuation Report for This Property
The Home Valuation Report is an in-depth analysis detailing your home's value as well as a comparison with similar homes in the area
Home Values in the Area
Average Home Value in this Area
Purchase History
| Date | Buyer | Sale Price | Title Company |
|---|---|---|---|
| Yang Ying | $132,000 | -- | |
| Bank Of America Na Lxs 2006-11 | $155,600 | -- | |
| Bailey Leah Jill | $114,000 | -- | |
| Bahler Elizabeth J | $102,500 | -- |
Source: Public Records
Mortgage History
| Date | Status | Borrower | Loan Amount |
|---|---|---|---|
| Open | Yang Ying | $99,000 | |
| Previous Owner | Bahler Elizabeth J | $35,000 | |
| Closed | Bailey Leah Jill | $0 |
Source: Public Records
Tax History Compared to Growth
Tax History
| Year | Tax Paid | Tax Assessment Tax Assessment Total Assessment is a certain percentage of the fair market value that is determined by local assessors to be the total taxable value of land and additions on the property. | Land | Improvement |
|---|---|---|---|---|
| 2025 | $4,773 | $187,120 | $50,240 | $136,880 |
| 2023 | $4,367 | $154,720 | $44,680 | $110,040 |
| 2022 | $4,017 | $130,920 | $27,160 | $103,760 |
| 2021 | $3,391 | $107,640 | $26,840 | $80,800 |
| 2020 | $3,286 | $102,080 | $23,560 | $78,520 |
| 2019 | $395 | $100,280 | $23,160 | $77,120 |
| 2018 | $2,912 | $89,400 | $21,120 | $68,280 |
| 2017 | $2,346 | $68,920 | $14,440 | $54,480 |
| 2016 | $2,312 | $68,920 | $14,440 | $54,480 |
| 2015 | $2,338 | $68,920 | $14,440 | $54,480 |
| 2014 | $2,333 | $66,160 | $14,280 | $51,880 |
Source: Public Records
Map
Nearby Homes
- 4740 Carversham Way
- 4790 Roswell Mill Dr
- 11390 Ridge Hill Dr
- 130 Douglas Fir Ct Unit 1
- 4965 N Bridges Dr
- 134 Wards Crossing Way Unit 17
- 11085 State Bridge Rd
- 4845 Weathervane Dr
- 4645 Valais Ct Unit 109
- 4965 Cinnabar Dr
- 200 Boca Ciega Ct
- 4815 Tanners Spring Dr
- 4905 Weathervane Dr
- 5022 Anclote Dr
- 690 Kimball Parc Way
- 680 Kimball Parc Way
- 5060 Cinnabar Dr
- 485 Portrait Cir
- 11125 Pinehigh Dr
- 4015 Breckenridge Ct
- 4735 Hanstedt Trace
- 4715 Hanstedt Trace
- 0 Hanstedt Trace
- 4720 Jones Bridge Woods Dr
- 4745 Hanstedt Trace
- 4705 Hanstedt Trace
- 4710 Jones Bridge Woods Dr
- 4720 Hanstedt Trace Unit 2
- 4710 Hanstedt Trace
- 4695 Jones Bridge Woods Dr
- 4755 Hanstedt Trace
- 4730 Jones Bridge Woods Dr
- 4695 Hanstedt Trace Unit 2
- 4715 Jones Bridge Woods Dr
- 11300 Bramshill Dr
- 4740 Hanstedt Trace
- 4700 Hanstedt Trace Unit 2
- 4740 Jones Bridge Woods Dr
- 4765 Hanstedt Trace
- 11310 Bramshill Dr