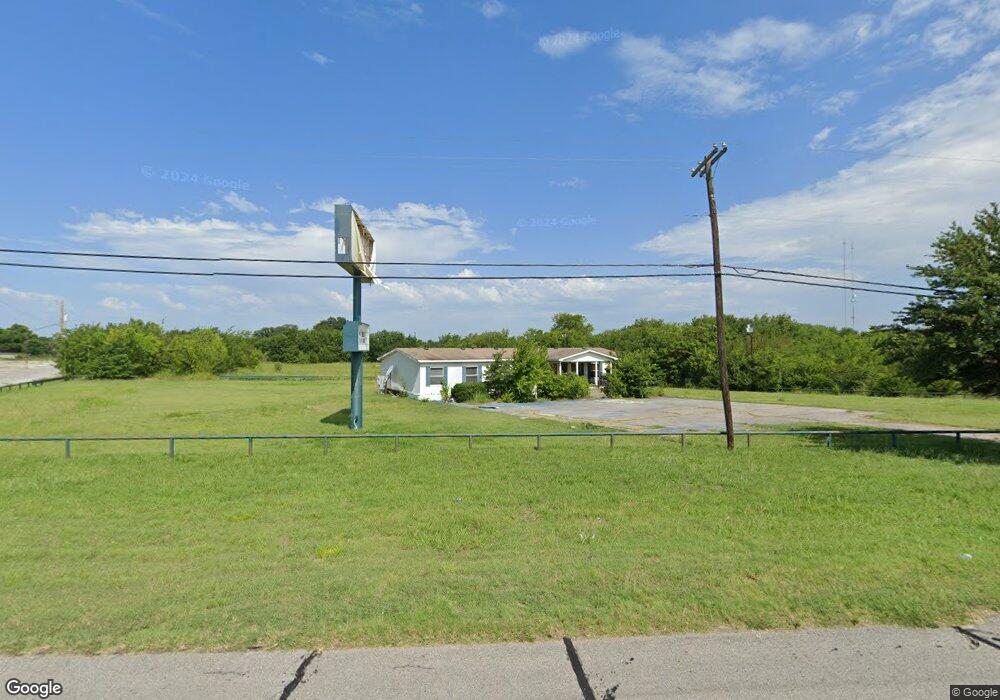
4725 Texoma Pkwy Denison, TX 75020
Estimated Value: $326,000
--
Bed
--
Bath
2,881
Sq Ft
$113/Sq Ft
Est. Value
About This Home
This home is located at 4725 Texoma Pkwy, Denison, TX 75020 and is currently priced at $326,000, approximately $113 per square foot. 4725 Texoma Pkwy is a home located in Grayson County with nearby schools including Hyde Park Elementary School, Scott Middle School, and Denison High School.
Ownership History
Date
Name
Owned For
Owner Type
Purchase Details
Closed on
Nov 14, 2022
Sold by
Jeje Holdings Llc
Bought by
Jcn Texoma Industrial Llc
Current Estimated Value
Purchase Details
Closed on
Jun 16, 2021
Sold by
Dmi Choice Properties Llc
Bought by
Jeje Holdings Llc
Home Financials for this Owner
Home Financials are based on the most recent Mortgage that was taken out on this home.
Original Mortgage
$196,000
Interest Rate
2.9%
Mortgage Type
Credit Line Revolving
Purchase Details
Closed on
Dec 1, 2010
Sold by
Campbell James Richard
Bought by
Herman Michael and Carr David
Purchase Details
Closed on
Jun 8, 2005
Sold by
Avary George Richard
Bought by
Avary George R
Home Financials for this Owner
Home Financials are based on the most recent Mortgage that was taken out on this home.
Original Mortgage
$220,000
Interest Rate
5.79%
Mortgage Type
Commercial
Create a Home Valuation Report for This Property
The Home Valuation Report is an in-depth analysis detailing your home's value as well as a comparison with similar homes in the area
Home Values in the Area
Average Home Value in this Area
Purchase History
| Date | Buyer | Sale Price | Title Company |
|---|---|---|---|
| Jcn Texoma Industrial Llc | -- | Simplifile | |
| Jeje Holdings Llc | -- | Grayson County Title | |
| Herman Michael | -- | Red River Title Co | |
| Avary George R | -- | -- |
Source: Public Records
Mortgage History
| Date | Status | Borrower | Loan Amount |
|---|---|---|---|
| Previous Owner | Jeje Holdings Llc | $196,000 | |
| Previous Owner | Avary George R | $220,000 | |
| Closed | Jcn Texoma Industrial Llc | $0 |
Source: Public Records
Tax History Compared to Growth
Tax History
| Year | Tax Paid | Tax Assessment Tax Assessment Total Assessment is a certain percentage of the fair market value that is determined by local assessors to be the total taxable value of land and additions on the property. | Land | Improvement |
|---|---|---|---|---|
| 2025 | $5,720 | $246,190 | $169,480 | $76,710 |
| 2024 | $5,720 | $246,190 | $173,614 | $72,576 |
| 2023 | $5,578 | $246,190 | $205,650 | $40,540 |
| 2022 | $5,849 | $246,190 | $205,650 | $40,540 |
| 2021 | $4,239 | $168,086 | $113,159 | $54,927 |
| 2020 | $4,434 | $168,086 | $113,159 | $54,927 |
| 2019 | $4,625 | $168,086 | $113,159 | $54,927 |
| 2018 | $4,663 | $168,086 | $113,159 | $54,927 |
| 2017 | $2,831 | $101,193 | $58,905 | $42,288 |
| 2016 | $2,825 | $100,973 | $58,905 | $42,068 |
| 2015 | $0 | $102,084 | $58,905 | $43,179 |
| 2014 | -- | $103,549 | $58,905 | $44,644 |
Source: Public Records
Map
Nearby Homes
- 2330 Knight Rd
- 4829 Adobe Ln
- TBD Adobe Ln
- 4813 Pinnacle Place
- 000 F M 691
- 4858 S Theresa
- 2014 & 1910 Shannon Rd
- 2025 Woodlake Rd
- 376 Tananger Springs Dr
- 30 Tananger Springs Dr
- 820 U S 75
- 920 Jefferson Way
- Evans Plan at Sweetwater Springs
- Peterson Plan at Sweetwater Springs
- 913 Jefferson Way
- Harrison Plan at Sweetwater Springs
- 924 Jefferson Way
- Murray Plan at Sweetwater Springs
- Kirby Plan at Sweetwater Springs
- Abbot Plan at Sweetwater Springs
- 2330 Longhorn Blvd
- 2325 Delton St
- 2329 Delton St
- 4725 Texoma Pkwy
- 4901 Texoma Pkwy
- 2218 Knight Rd
- 2322 Delton St
- 2330/TBD Knight Rd
- TBD Knight Rd
- 4901 S State Highway 91
- 4830 Adobe Ln
- 4726 S State Highway 91
- 2219 Knight Rd
- 4702 S Texoma Pkwy
- 4820 Texoma Pkwy
- 2101 Knight Rd
- 2021 Knight Rd
- 2321 Knight Rd
- 4827 Adobe Ln
- 2015 Knight Rd