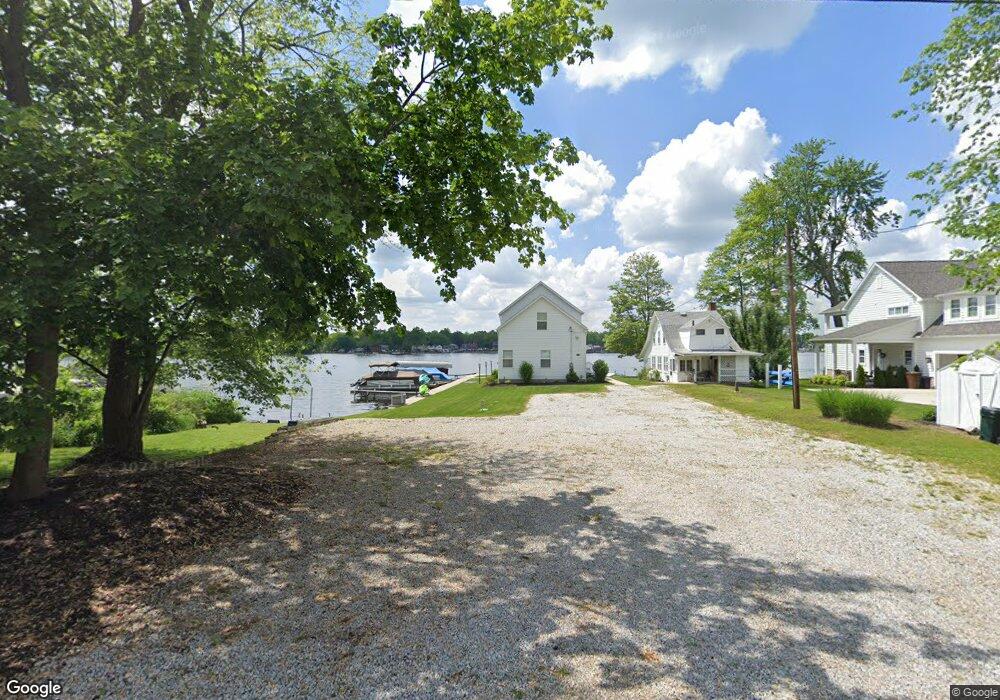
4726 Bickford Ave New Franklin, OH 44319
Estimated Value: $228,519 - $478,000
3
Beds
1
Bath
744
Sq Ft
$458/Sq Ft
Est. Value
About This Home
This home is located at 4726 Bickford Ave, New Franklin, OH 44319 and is currently estimated at $340,630, approximately $457 per square foot. 4726 Bickford Ave is a home located in Summit County with nearby schools including Nolley Elementary School, Manchester Middle School, and Manchester High School.
Ownership History
Date
Name
Owned For
Owner Type
Purchase Details
Closed on
Jul 27, 2010
Sold by
Filicky Thomas E and Filicky Joan I
Bought by
Filicky Thomas E and The Thomas E Filicky Family Trust
Current Estimated Value
Home Financials for this Owner
Home Financials are based on the most recent Mortgage that was taken out on this home.
Original Mortgage
$65,600
Outstanding Balance
$43,701
Interest Rate
4.77%
Mortgage Type
Seller Take Back
Estimated Equity
$296,929
Purchase Details
Closed on
Jun 29, 2010
Sold by
Gray Maria L and Gray Gregory M
Bought by
Filicky Thomas E
Home Financials for this Owner
Home Financials are based on the most recent Mortgage that was taken out on this home.
Original Mortgage
$65,600
Outstanding Balance
$43,701
Interest Rate
4.77%
Mortgage Type
Seller Take Back
Estimated Equity
$296,929
Purchase Details
Closed on
May 21, 2010
Sold by
Yoder Jodi and Yoder Randal T
Bought by
Filicky Thomas E
Home Financials for this Owner
Home Financials are based on the most recent Mortgage that was taken out on this home.
Original Mortgage
$65,600
Outstanding Balance
$43,701
Interest Rate
4.77%
Mortgage Type
Seller Take Back
Estimated Equity
$296,929
Purchase Details
Closed on
Dec 23, 2009
Sold by
Gray Maria L
Bought by
Gray Maria L and Yoder Jodi A
Create a Home Valuation Report for This Property
The Home Valuation Report is an in-depth analysis detailing your home's value as well as a comparison with similar homes in the area
Home Values in the Area
Average Home Value in this Area
Purchase History
| Date | Buyer | Sale Price | Title Company |
|---|---|---|---|
| Filicky Thomas E | -- | Attorney | |
| Filicky Thomas E | $65,600 | Attorney | |
| Filicky Thomas E | $80,000 | Landamerica | |
| Gray Maria L | -- | Attorney |
Source: Public Records
Mortgage History
| Date | Status | Borrower | Loan Amount |
|---|---|---|---|
| Open | Filicky Thomas E | $65,600 | |
| Previous Owner | Filicky Thomas E | $83,000 |
Source: Public Records
Tax History Compared to Growth
Tax History
| Year | Tax Paid | Tax Assessment Tax Assessment Total Assessment is a certain percentage of the fair market value that is determined by local assessors to be the total taxable value of land and additions on the property. | Land | Improvement |
|---|---|---|---|---|
| 2025 | $4,413 | $86,685 | $40,394 | $46,291 |
| 2024 | $4,413 | $86,685 | $40,394 | $46,291 |
| 2023 | $4,413 | $86,685 | $40,394 | $46,291 |
| 2022 | $3,775 | $57,789 | $26,929 | $30,860 |
| 2021 | $3,789 | $57,789 | $26,929 | $30,860 |
| 2020 | $3,718 | $57,790 | $26,930 | $30,860 |
| 2019 | $3,093 | $42,930 | $27,710 | $15,220 |
| 2018 | $2,678 | $42,930 | $27,710 | $15,220 |
| 2017 | $2,748 | $42,930 | $27,710 | $15,220 |
| 2016 | $2,715 | $39,910 | $27,710 | $12,200 |
| 2015 | $2,748 | $39,910 | $27,710 | $12,200 |
| 2014 | $2,728 | $39,910 | $27,710 | $12,200 |
| 2013 | $2,718 | $40,010 | $27,710 | $12,300 |
Source: Public Records
Map
Nearby Homes
- lot 8 Whyem Dr
- S/L 14,15 Shakes Hotel Dr
- 7 Shrakes Hotel Dr
- 5 Shrakes Hotel Dr
- 3 Shrakes Hotel Dr
- 4674 S Main St
- 6 Shrakes Hotel Dr
- 4 Shrakes Hotel Dr
- 4881 S Main St
- 4944 Coleman Dr
- 410 Silk Ct
- 4831 Christman Rd
- 4298 S Main St Unit 4302
- 4138 S Main St
- 68 Starboard Cir
- 2 Starboard Cir Unit 77
- 63 Starboard Cir Unit 64
- 4131 State Park Dr
- 3917 Cayugas Dr
- 683 Chilham Cir
- 185 Porter Ave
- 4722 Bickford Ave
- 181 Porter Ave
- 4720 Bickford Ave
- 4730 Bickford Ave
- 177 Porter Ave
- 177 Porter Ave
- 4737 Bickford Ave
- 4716 Bickford Ave
- 4741 Bickford Ave
- 173 Porter Ave
- 4714 Bickford Ave
- 4745 Bickford Ave
- 4745 Bickford Ave
- 176 Porter Ave
- 4708 Bickford Ave
- 172 Porter Ave
- 172 Mix Ave
- 4763 Bickford Ave
- 4704 Panay Dr