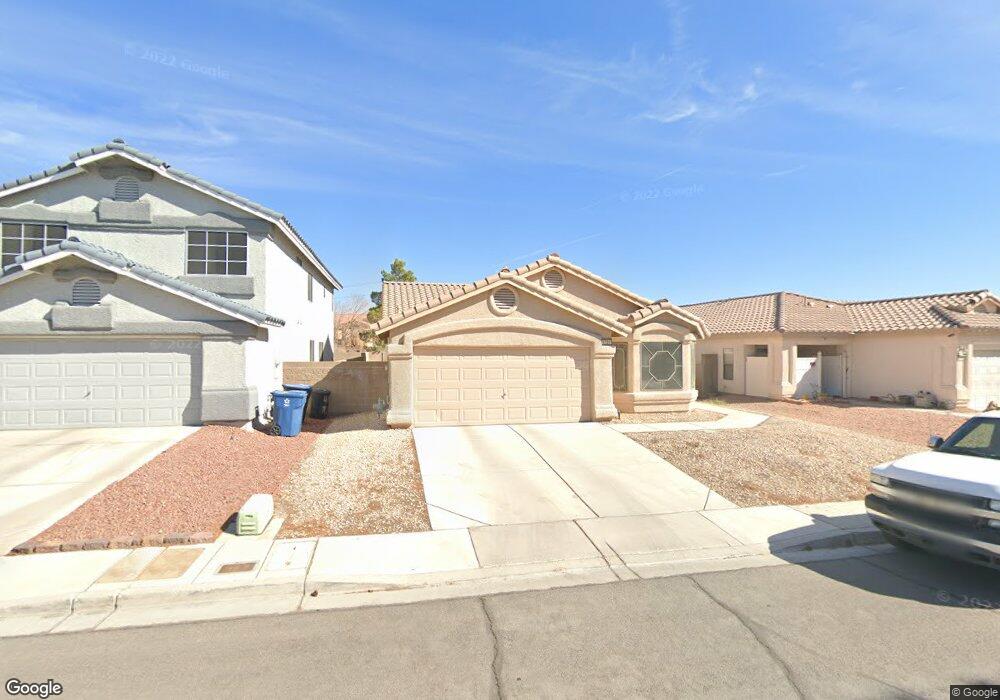
4726 Roby Grey Way North Las Vegas, NV 89081
Northridge NeighborhoodEstimated Value: $377,000 - $386,000
3
Beds
2
Baths
1,557
Sq Ft
$245/Sq Ft
Est. Value
About This Home
This home is located at 4726 Roby Grey Way, North Las Vegas, NV 89081 and is currently estimated at $381,054, approximately $244 per square foot. 4726 Roby Grey Way is a home located in Clark County with nearby schools including Jesse D. Scott Elementary School, Clifford O. Findlay Middle School, and Mojave High School.
Ownership History
Date
Name
Owned For
Owner Type
Purchase Details
Closed on
Feb 25, 2003
Sold by
Harvey Lana D
Bought by
Chong Nayon
Current Estimated Value
Home Financials for this Owner
Home Financials are based on the most recent Mortgage that was taken out on this home.
Original Mortgage
$95,000
Outstanding Balance
$40,989
Interest Rate
5.93%
Estimated Equity
$340,065
Purchase Details
Closed on
Sep 7, 1999
Sold by
Dukes Jane M and Collett Jane M
Bought by
Harvey Lana D
Home Financials for this Owner
Home Financials are based on the most recent Mortgage that was taken out on this home.
Original Mortgage
$118,750
Interest Rate
7.89%
Purchase Details
Closed on
Feb 20, 1997
Sold by
Del Webbs Coventry Homes Of Nevada Inc
Bought by
Collett Jane M
Home Financials for this Owner
Home Financials are based on the most recent Mortgage that was taken out on this home.
Original Mortgage
$115,260
Interest Rate
7.86%
Mortgage Type
VA
Create a Home Valuation Report for This Property
The Home Valuation Report is an in-depth analysis detailing your home's value as well as a comparison with similar homes in the area
Home Values in the Area
Average Home Value in this Area
Purchase History
| Date | Buyer | Sale Price | Title Company |
|---|---|---|---|
| Chong Nayon | $140,000 | Pioneer National Title | |
| Harvey Lana D | $125,000 | Old Republic Title Company | |
| Dukes Jane M | -- | Old Republic Title Company | |
| Collett Jane M | $114,500 | First American Title Co |
Source: Public Records
Mortgage History
| Date | Status | Borrower | Loan Amount |
|---|---|---|---|
| Open | Chong Nayon | $95,000 | |
| Previous Owner | Dukes Jane M | $118,750 | |
| Previous Owner | Collett Jane M | $115,260 |
Source: Public Records
Tax History Compared to Growth
Tax History
| Year | Tax Paid | Tax Assessment Tax Assessment Total Assessment is a certain percentage of the fair market value that is determined by local assessors to be the total taxable value of land and additions on the property. | Land | Improvement |
|---|---|---|---|---|
| 2025 | $1,328 | $92,560 | $31,500 | $61,060 |
| 2024 | $1,290 | $92,560 | $31,500 | $61,060 |
| 2023 | $1,052 | $88,156 | $30,100 | $58,056 |
| 2022 | $1,252 | $76,364 | $23,100 | $53,264 |
| 2021 | $1,216 | $73,745 | $23,100 | $50,645 |
| 2020 | $1,178 | $71,696 | $21,350 | $50,346 |
| 2019 | $1,143 | $67,496 | $17,850 | $49,646 |
| 2018 | $1,110 | $62,661 | $14,700 | $47,961 |
| 2017 | $1,844 | $54,959 | $12,600 | $42,359 |
| 2016 | $1,052 | $47,236 | $9,800 | $37,436 |
| 2015 | $1,049 | $37,260 | $7,000 | $30,260 |
| 2014 | $1,018 | $29,454 | $5,250 | $24,204 |
Source: Public Records
Map
Nearby Homes
- 4746 Roby Grey Way
- 1512 Groom Ave
- 4733 Cliff Breeze Dr
- 4905 Blue Rose St
- 1106 Granite Ash Ave
- 1413 Fantastic Ct
- 1405 Fantastic Ct
- 4848 Cutting Diamond Ct
- 4640 Cliff Breeze Dr
- 4847 Kinworthy St
- 1310 Ripplestone Ave
- 1014 Edgestone Mark Ave
- 2213 Dale Bumpers Ct
- 1016 Stoneypeak Ave
- 748 Stagecoach Ave
- 4935 Stormy Ridge St
- 5025 Blue Rose St
- 1214 Emerald Stone Ave
- 1022 Cliffbrook Hedge Ave Unit 3
- 1014 Cliffbrook Hedge Ave
- 4722 Roby Grey Way
- 4730 Roby Grey Way
- 4718 Roby Grey Way
- 4734 Roby Grey Way
- 4714 Roby Grey Way
- 4714 Roby Grey Way
- 4714 Roby Grey Way Unit na
- 4738 Roby Grey Way
- 4727 Roby Grey Way
- 4719 Roby Grey Way
- 4731 Roby Grey Way
- 4710 Roby Grey Way
- 4742 Roby Grey Way
- 4715 Roby Grey Way
- 4735 Roby Grey Way
- 4711 Roby Grey Way
- 1423 Old Cobble Dr
- 4706 Roby Grey Way
- 4707 Roby Grey Way
- 4712 Possum Berry Ln