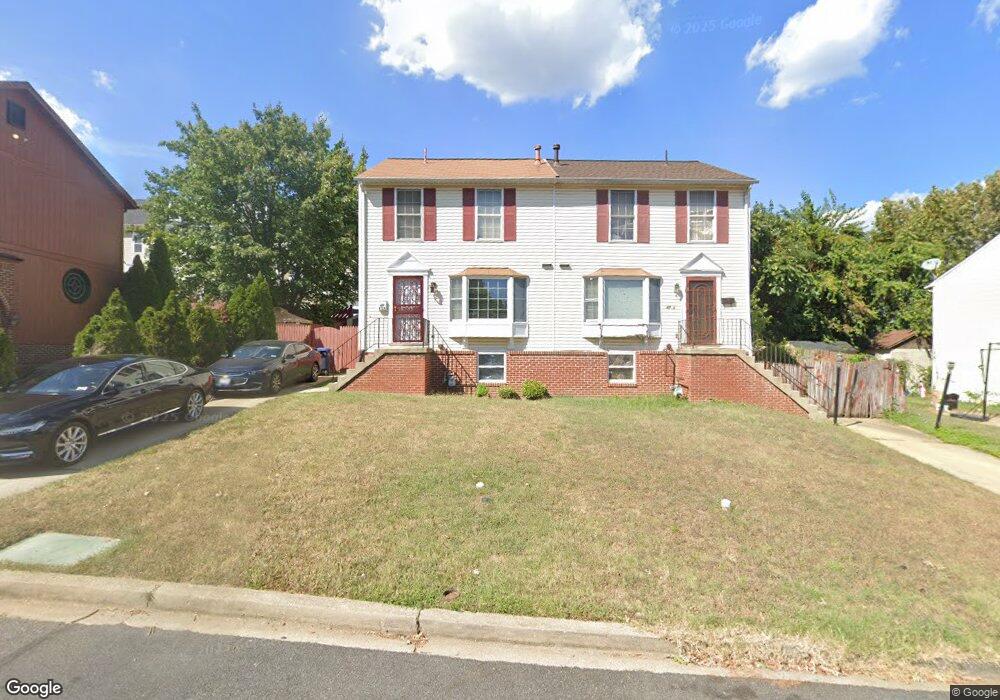
4728 6th Place NE Washington, DC 20017
Michigan Park NeighborhoodEstimated Value: $480,965 - $606,000
3
Beds
3
Baths
1,120
Sq Ft
$480/Sq Ft
Est. Value
About This Home
This home is located at 4728 6th Place NE, Washington, DC 20017 and is currently estimated at $537,491, approximately $479 per square foot. 4728 6th Place NE is a home located in District of Columbia with nearby schools including Bunker Hill Elementary School, Brookland Middle School, and Dunbar High School.
Ownership History
Date
Name
Owned For
Owner Type
Purchase Details
Closed on
May 21, 2024
Sold by
Blount Nee and Johnson Julia B
Bought by
Johnson Odell W and Johnson Julia B
Current Estimated Value
Purchase Details
Closed on
May 13, 1996
Sold by
Pickett Melvin
Bought by
Blount Julia B
Home Financials for this Owner
Home Financials are based on the most recent Mortgage that was taken out on this home.
Original Mortgage
$122,700
Interest Rate
7.67%
Purchase Details
Closed on
Feb 2, 1995
Sold by
Rbd Buchanan Street Inc
Bought by
Pickett Melvin
Home Financials for this Owner
Home Financials are based on the most recent Mortgage that was taken out on this home.
Original Mortgage
$200,000
Interest Rate
9.13%
Create a Home Valuation Report for This Property
The Home Valuation Report is an in-depth analysis detailing your home's value as well as a comparison with similar homes in the area
Home Values in the Area
Average Home Value in this Area
Purchase History
| Date | Buyer | Sale Price | Title Company |
|---|---|---|---|
| Johnson Odell W | -- | None Listed On Document | |
| Blount Julia B | $139,500 | -- | |
| Pickett Melvin | $60,000 | -- |
Source: Public Records
Mortgage History
| Date | Status | Borrower | Loan Amount |
|---|---|---|---|
| Previous Owner | Blount Julia B | $122,700 | |
| Previous Owner | Pickett Melvin | $200,000 | |
| Closed | Blount Julia B | $15,607 |
Source: Public Records
Tax History Compared to Growth
Tax History
| Year | Tax Paid | Tax Assessment Tax Assessment Total Assessment is a certain percentage of the fair market value that is determined by local assessors to be the total taxable value of land and additions on the property. | Land | Improvement |
|---|---|---|---|---|
| 2025 | $1,509 | $524,250 | $332,490 | $191,760 |
| 2024 | $1,491 | $518,530 | $330,830 | $187,700 |
| 2023 | $1,475 | $499,520 | $321,810 | $177,710 |
| 2022 | $1,468 | $464,710 | $300,710 | $164,000 |
| 2021 | $1,407 | $448,510 | $293,230 | $155,280 |
| 2020 | $1,343 | $440,400 | $287,920 | $152,480 |
| 2019 | $1,282 | $407,440 | $263,380 | $144,060 |
| 2018 | $1,227 | $381,780 | $0 | $0 |
| 2017 | $1,119 | $354,380 | $0 | $0 |
| 2016 | $1,020 | $337,460 | $0 | $0 |
| 2015 | $929 | $302,800 | $0 | $0 |
| 2014 | $1,699 | $270,090 | $0 | $0 |
Source: Public Records
Map
Nearby Homes
- 4717 7th St NE
- 723 Emerson St NE
- 735 Emerson St NE
- 642 Faraday Place NE
- 719 Farragut Place NE
- 832 Delafield St NE
- 838 Buchanan St NE
- 5031 S Dakota Ave NE
- 314 Farragut St NW
- 4803 10th St NE
- 5008 10th St NE
- 5051 8th St NE
- 5024 10th St NE
- 5008 11th St NE
- 4937 11th St NE
- 4822 S Dakota Ave NE
- 500 Hamilton St NE
- 227 Hawaii Ave NE
- 215 Hawaii Ave NE
- 4913 12th St NE
- 4730 6th Place NE
- 4726 6th Place NE
- 4732 6th Place NE
- 4724 6th Place NE
- 624 Totten Place NE
- 4713 6th Place NE
- 4734 6th Place NE
- 4722 6th Place NE
- 620 Totten Place NE
- 4711 6th Place NE
- 4736 6th Place NE
- 618 Totten Place NE
- 4738 6th Place NE
- 4720 6th Place NE
- 614 Totten Place NE
- 4715 6th Place NE
- 4718 6th Place NE
- 4709 6th Place NE
- 612 Totten Place NE
- 4810 7th St NE