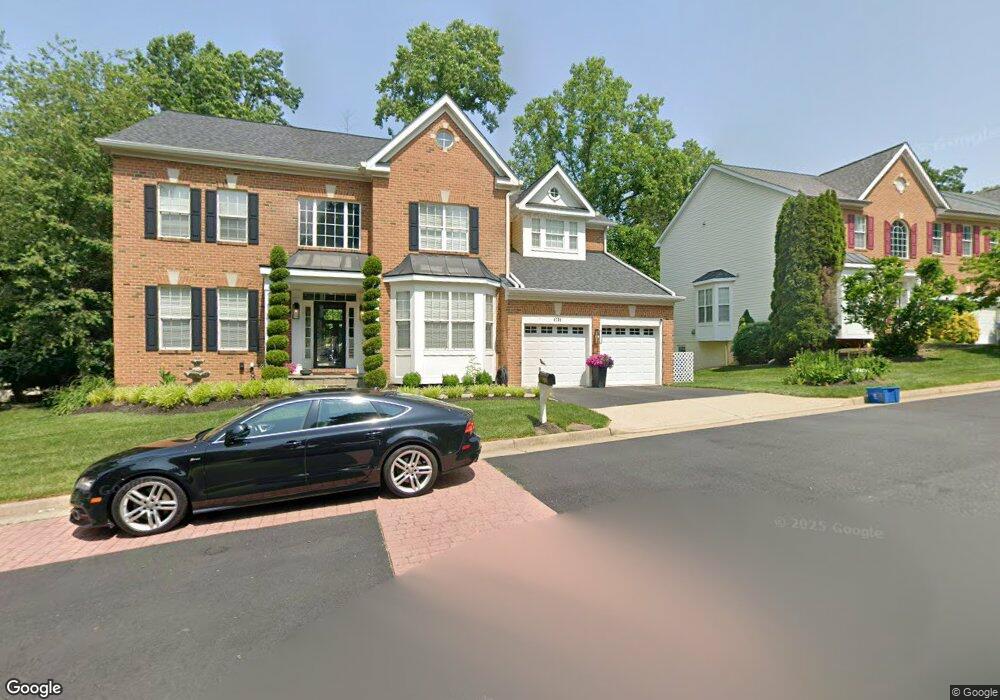
4728 Feature Oak Way Fairfax, VA 22032
Estimated Value: $1,149,816 - $1,354,000
5
Beds
5
Baths
3,504
Sq Ft
$352/Sq Ft
Est. Value
About This Home
This home is located at 4728 Feature Oak Way, Fairfax, VA 22032 and is currently estimated at $1,233,704, approximately $352 per square foot. 4728 Feature Oak Way is a home located in Fairfax County with nearby schools including Laurel Ridge Elementary School, James W Robinson, Jr. Secondary School, and Holy Spirit School.
Ownership History
Date
Name
Owned For
Owner Type
Purchase Details
Closed on
Apr 8, 2024
Sold by
Sands Manuel A and Sands Ruth
Bought by
Sands Family Living Trust and Sands
Current Estimated Value
Purchase Details
Closed on
Jan 11, 2021
Sold by
Sands Manuel A and Sands Ruth
Bought by
Sands Manuel A and Sands Ruth
Home Financials for this Owner
Home Financials are based on the most recent Mortgage that was taken out on this home.
Original Mortgage
$394,000
Interest Rate
2.25%
Mortgage Type
New Conventional
Purchase Details
Closed on
Nov 23, 2015
Sold by
Sands Manuel A and Sands Ruth
Bought by
Sands Family Living Trust
Purchase Details
Closed on
Apr 26, 2001
Sold by
Courtland Ct Powell Rd Ll
Bought by
Sands Manuel A
Home Financials for this Owner
Home Financials are based on the most recent Mortgage that was taken out on this home.
Original Mortgage
$425,000
Interest Rate
6.88%
Create a Home Valuation Report for This Property
The Home Valuation Report is an in-depth analysis detailing your home's value as well as a comparison with similar homes in the area
Home Values in the Area
Average Home Value in this Area
Purchase History
| Date | Buyer | Sale Price | Title Company |
|---|---|---|---|
| Sands Family Living Trust | -- | None Listed On Document | |
| Sands Manuel A | -- | Westcor Land Title Ins Co | |
| Sands Family Living Trust | -- | None Available | |
| Sands Manuel A | $567,557 | -- |
Source: Public Records
Mortgage History
| Date | Status | Borrower | Loan Amount |
|---|---|---|---|
| Previous Owner | Sands Manuel A | $394,000 | |
| Previous Owner | Sands Manuel A | $425,000 |
Source: Public Records
Tax History Compared to Growth
Tax History
| Year | Tax Paid | Tax Assessment Tax Assessment Total Assessment is a certain percentage of the fair market value that is determined by local assessors to be the total taxable value of land and additions on the property. | Land | Improvement |
|---|---|---|---|---|
| 2025 | $12,882 | $1,180,510 | $363,000 | $817,510 |
| 2024 | $12,882 | $1,111,930 | $363,000 | $748,930 |
| 2023 | $12,600 | $1,116,540 | $363,000 | $753,540 |
| 2022 | $10,830 | $947,070 | $303,000 | $644,070 |
| 2021 | $10,016 | $853,510 | $278,000 | $575,510 |
| 2020 | $9,478 | $800,860 | $263,000 | $537,860 |
| 2019 | $9,356 | $790,530 | $258,000 | $532,530 |
| 2018 | $9,091 | $790,530 | $258,000 | $532,530 |
| 2017 | $8,769 | $755,320 | $238,000 | $517,320 |
| 2016 | $8,479 | $731,920 | $228,000 | $503,920 |
| 2015 | $8,168 | $731,920 | $228,000 | $503,920 |
| 2014 | $8,384 | $752,920 | $228,000 | $524,920 |
Source: Public Records
Map
Nearby Homes
- 9640 Park Preserve Dr
- 4906 Mcfarland Dr
- 9604 Braddock Rd
- 4716 Pickett Rd
- 4869 Nash Dr
- 4947 Mcfarland Ct
- 4522 Pickett Rd
- 4618 Twinbrook Rd
- 5006 Lone Oak Place
- 5019 Powell Rd
- 9883 Becket Ct
- 4601 Tara Dr
- 9717 Commonwealth Blvd
- 4401 Pickett Rd
- 4303 Branchview Way
- 5135 Richardson Dr
- 5122 Pommeroy Dr
- 5137 Richardson Dr
- 10134 Red Spruce Rd
- 4629 Briar Patch Ct
- 4726 Feature Oak Way
- 4730 Feature Oak Way
- 9646 Park Preserve Dr
- 4985 Dequincey Dr
- 4724 Feature Oak Way
- 4983 Dequincey Dr
- 4732 Feature Oak Way
- 9645 Park Preserve Dr
- 4725 Feature Oak Way
- 4981 Dequincey Dr
- 4989 Dequincey Dr
- 4722 Feature Oak Way
- 9644 Park Preserve Dr
- 4734 Feature Oak Way
- 4733 Feature Oak Way
- 4979 Dequincey Dr
- 4991 Dequincey Dr
- 9642 Park Preserve Dr
- 4721 Feature Oak Way
- 4720 Feature Oak Way