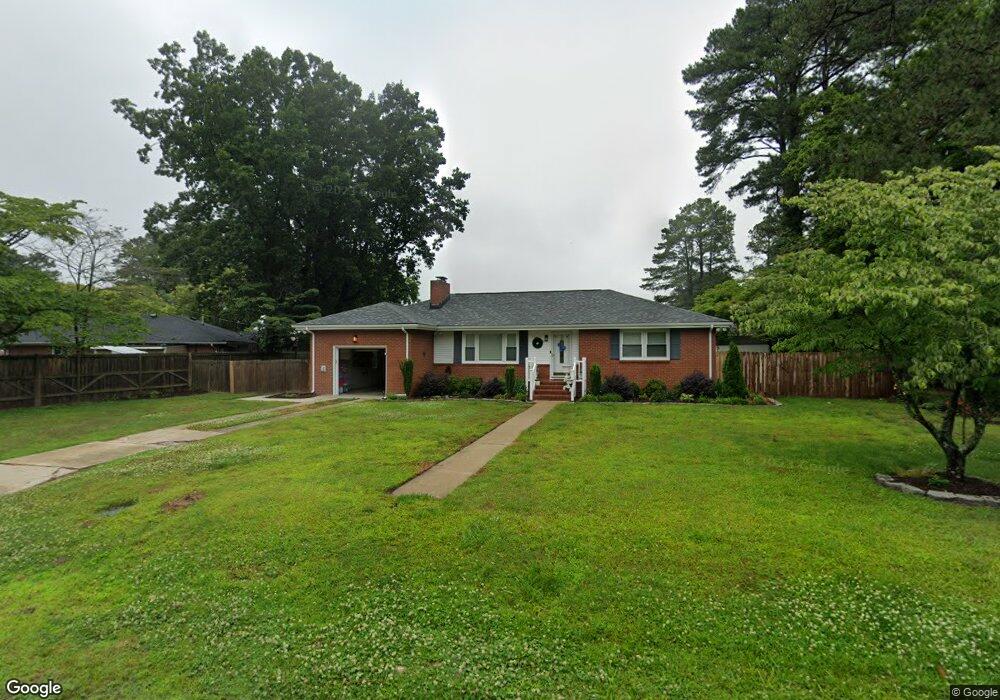
4728 Haywood Dr Portsmouth, VA 23703
Churchland NeighborhoodEstimated Value: $297,812 - $306,000
3
Beds
1
Bath
1,306
Sq Ft
$231/Sq Ft
Est. Value
About This Home
This home is located at 4728 Haywood Dr, Portsmouth, VA 23703 and is currently estimated at $301,453, approximately $230 per square foot. 4728 Haywood Dr is a home located in Portsmouth City with nearby schools including Churchland Elementary School, Churchland Academy Elementary School, and Churchland Middle School.
Ownership History
Date
Name
Owned For
Owner Type
Purchase Details
Closed on
Apr 13, 2023
Sold by
Frank Andrea C
Bought by
Bunton Erin M
Current Estimated Value
Home Financials for this Owner
Home Financials are based on the most recent Mortgage that was taken out on this home.
Original Mortgage
$208,000
Outstanding Balance
$201,803
Interest Rate
6.42%
Mortgage Type
New Conventional
Estimated Equity
$99,650
Purchase Details
Closed on
Jul 31, 2018
Sold by
Walker James M and Walker Margaret C
Bought by
Frank Andrea C
Home Financials for this Owner
Home Financials are based on the most recent Mortgage that was taken out on this home.
Original Mortgage
$177,721
Interest Rate
4.5%
Mortgage Type
FHA
Purchase Details
Closed on
Apr 3, 2014
Sold by
Lilienthal Elisa
Bought by
Walker James M
Home Financials for this Owner
Home Financials are based on the most recent Mortgage that was taken out on this home.
Original Mortgage
$108,337
Interest Rate
4.33%
Mortgage Type
VA
Create a Home Valuation Report for This Property
The Home Valuation Report is an in-depth analysis detailing your home's value as well as a comparison with similar homes in the area
Home Values in the Area
Average Home Value in this Area
Purchase History
| Date | Buyer | Sale Price | Title Company |
|---|---|---|---|
| Bunton Erin M | $260,000 | Old Republic National Title | |
| Frank Andrea C | $181,000 | Priority Title & Escrow | |
| Walker James M | $132,000 | -- |
Source: Public Records
Mortgage History
| Date | Status | Borrower | Loan Amount |
|---|---|---|---|
| Open | Bunton Erin M | $208,000 | |
| Previous Owner | Frank Andrea C | $177,721 | |
| Previous Owner | Walker James M | $108,337 |
Source: Public Records
Tax History Compared to Growth
Tax History
| Year | Tax Paid | Tax Assessment Tax Assessment Total Assessment is a certain percentage of the fair market value that is determined by local assessors to be the total taxable value of land and additions on the property. | Land | Improvement |
|---|---|---|---|---|
| 2025 | $3,286 | $258,130 | $89,040 | $169,090 |
| 2024 | $3,286 | $253,270 | $89,040 | $164,230 |
| 2023 | $3,109 | $235,050 | $89,040 | $146,010 |
| 2022 | $2,784 | $214,130 | $74,200 | $139,930 |
| 2021 | $2,394 | $184,160 | $50,300 | $133,860 |
| 2020 | $2,331 | $179,340 | $47,910 | $131,430 |
| 2019 | $2,316 | $178,130 | $47,910 | $130,220 |
| 2018 | $2,284 | $175,700 | $47,910 | $127,790 |
| 2017 | $2,284 | $175,700 | $47,910 | $127,790 |
| 2016 | $2,284 | $175,700 | $47,910 | $127,790 |
| 2015 | $2,205 | $169,620 | $47,910 | $121,710 |
| 2014 | $2,151 | $169,370 | $47,910 | $121,460 |
Source: Public Records
Map
Nearby Homes
- 4313 Templar Dr
- 3200 Westwood Crescent
- 3405 Canterbury Dr
- 3408 Wakefield Dr
- 5006 High St W
- 4417 Gannon Rd
- 4705 Templar Dr
- 3425 Cedar Ln
- 4707 High St W
- 4412 Gannon Rd
- 3233 Clover Hill Dr
- 3205 Clover Hill Dr
- 5220 Clover Hill Dr
- 3509 Spence Rd
- 4011 Reese Dr S
- 2805 Acres Rd
- 5221 High St W
- 4305 Manchester Rd
- 4517 Wake Forest Rd
- 3130 Sterling Point Dr
- 4724 Haywood Dr
- 3217 Madden Terrace
- 4733 Viola Terrace
- 3211 Madden Terrace
- 4725 Viola Terrace
- 3221 Madden Terrace
- 4720 Haywood Dr
- 3212 Madden Terrace
- 4725 Haywood Dr
- 3208 Madden Terrace
- 4721 Viola Terrace
- 3216 Madden Terrace
- 4728 Viola Terrace
- 4716 Haywood Dr
- 4724 Viola Terrace
- 3204 Madden Terrace
- 3304 Carney Farm Ln
- 3209 Madden Terrace
- 4732 Viola Terrace
- 4720 Viola Terrace