Estimated Value: $480,000 - $631,000
3
Beds
1
Bath
1,237
Sq Ft
$438/Sq Ft
Est. Value
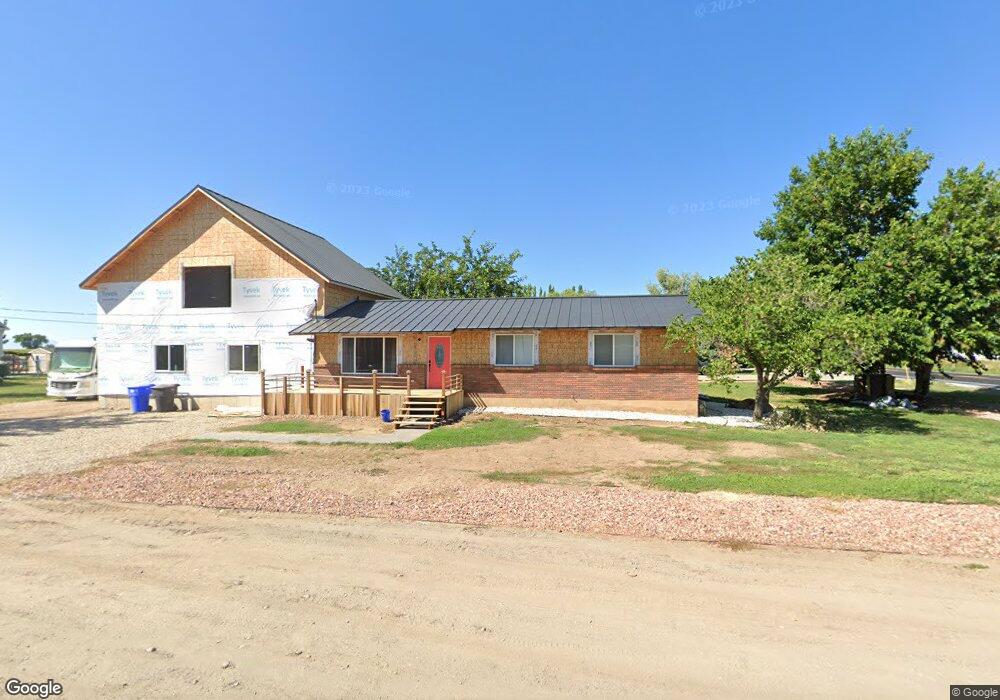
About This Home
This home is located at 4728 W 1500 N, Ogden, UT 84404 and is currently estimated at $541,894, approximately $438 per square foot. 4728 W 1500 N is a home located in Weber County with nearby schools including West Weber School, Wahlquist Junior High School, and Fremont High School.
Ownership History
Date
Name
Owned For
Owner Type
Purchase Details
Closed on
May 19, 2005
Sold by
Surrage Tyler B and Surrage Sherdene D
Bought by
Modahl Shelley K
Current Estimated Value
Home Financials for this Owner
Home Financials are based on the most recent Mortgage that was taken out on this home.
Original Mortgage
$108,000
Outstanding Balance
$56,420
Interest Rate
5.87%
Mortgage Type
Fannie Mae Freddie Mac
Estimated Equity
$485,474
Purchase Details
Closed on
Aug 24, 1999
Sold by
Hatch Donna
Bought by
Surrage Tyler B
Home Financials for this Owner
Home Financials are based on the most recent Mortgage that was taken out on this home.
Original Mortgage
$95,060
Interest Rate
7.56%
Mortgage Type
Purchase Money Mortgage
Purchase Details
Closed on
Nov 11, 1996
Sold by
Hatch Tony T
Bought by
Hatch Donna S J
Create a Home Valuation Report for This Property
The Home Valuation Report is an in-depth analysis detailing your home's value as well as a comparison with similar homes in the area
Home Values in the Area
Average Home Value in this Area
Purchase History
| Date | Buyer | Sale Price | Title Company |
|---|---|---|---|
| Modahl Shelley K | -- | Mountain View Title Ogden | |
| Surrage Tyler B | -- | Bonneville Title | |
| Hatch Donna S J | -- | -- |
Source: Public Records
Mortgage History
| Date | Status | Borrower | Loan Amount |
|---|---|---|---|
| Open | Modahl Shelley K | $108,000 | |
| Previous Owner | Surrage Tyler B | $95,060 |
Source: Public Records
Tax History Compared to Growth
Tax History
| Year | Tax Paid | Tax Assessment Tax Assessment Total Assessment is a certain percentage of the fair market value that is determined by local assessors to be the total taxable value of land and additions on the property. | Land | Improvement |
|---|---|---|---|---|
| 2025 | $2,141 | $445,065 | $142,792 | $302,273 |
| 2024 | $2,057 | $241,999 | $78,535 | $163,464 |
| 2023 | $1,666 | $194,150 | $86,735 | $107,415 |
| 2022 | $1,895 | $223,850 | $75,819 | $148,031 |
| 2021 | $1,450 | $291,000 | $64,213 | $226,787 |
| 2020 | $1,377 | $255,000 | $43,832 | $211,168 |
| 2019 | $1,318 | $230,999 | $33,697 | $197,302 |
| 2018 | $1,180 | $198,001 | $33,697 | $164,304 |
| 2017 | $987 | $158,000 | $26,526 | $131,474 |
| 2016 | $878 | $76,842 | $16,052 | $60,790 |
| 2015 | $800 | $68,602 | $16,052 | $52,550 |
| 2014 | $763 | $64,546 | $18,850 | $45,696 |
Source: Public Records
Map
Nearby Homes
- 4494 W 1600 N
- 4370 W 1500 N
- 4227 W Pioneer Rd
- 1239 N 4925 W
- 1885 N 4475 W
- 1853 N 4425 West St
- 1980 N 4650 W
- 1221 N 4975 W
- 2131 N 4650 W
- 1748 N 4100 St W
- 4210 W 1975 N
- 2416 N 4275 W
- 3966 W 2200 N
- 3622 W 2200 St N Unit 23
- 3782 W 2100 N
- 4212 W 1975 N
- 3594 W 2200 N Unit 3
- 2255 N 3600 St W Unit 21
- 2233 N 3600 St W Unit 22
- 155 S 4700 W