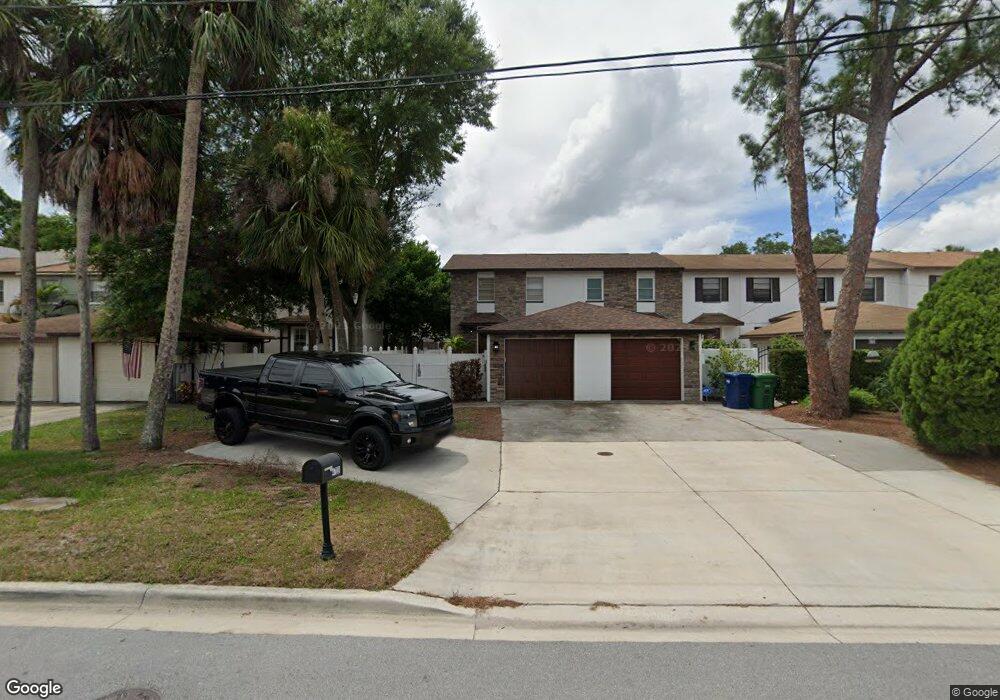
4728 W Cherokee Rd Tampa, FL 33629
Belmar NeighborhoodEstimated Value: $315,834 - $381,000
2
Beds
2
Baths
1,280
Sq Ft
$276/Sq Ft
Est. Value
About This Home
This home is located at 4728 W Cherokee Rd, Tampa, FL 33629 and is currently estimated at $353,459, approximately $276 per square foot. 4728 W Cherokee Rd is a home located in Hillsborough County with nearby schools including Mabry Elementary School, Coleman Middle School, and Plant High School.
Ownership History
Date
Name
Owned For
Owner Type
Purchase Details
Closed on
Apr 30, 2008
Sold by
Hollar Otis L and Hollar Simone C
Bought by
Hollar Otis L and Hollar Simone C
Current Estimated Value
Purchase Details
Closed on
Nov 24, 2003
Sold by
Hering Karen B and Hering Karen Brown
Bought by
Mosholder Phillip D
Home Financials for this Owner
Home Financials are based on the most recent Mortgage that was taken out on this home.
Original Mortgage
$147,831
Outstanding Balance
$68,868
Interest Rate
6.07%
Mortgage Type
FHA
Estimated Equity
$284,591
Purchase Details
Closed on
Oct 2, 2000
Sold by
Italiano Brenda G
Bought by
Hering Karen B
Home Financials for this Owner
Home Financials are based on the most recent Mortgage that was taken out on this home.
Original Mortgage
$102,000
Interest Rate
7.92%
Mortgage Type
New Conventional
Purchase Details
Closed on
Jan 18, 2000
Sold by
Italiano Anthony S and Dillion Mallory
Bought by
Italiano Brenda G
Create a Home Valuation Report for This Property
The Home Valuation Report is an in-depth analysis detailing your home's value as well as a comparison with similar homes in the area
Home Values in the Area
Average Home Value in this Area
Purchase History
| Date | Buyer | Sale Price | Title Company |
|---|---|---|---|
| Hollar Otis L | -- | The Title Depot Inc | |
| Mosholder Phillip D | $149,000 | Sunbelt Title Agency | |
| Hering Karen B | $113,500 | -- | |
| Italiano Brenda G | -- | -- |
Source: Public Records
Mortgage History
| Date | Status | Borrower | Loan Amount |
|---|---|---|---|
| Open | Mosholder Phillip D | $147,831 | |
| Previous Owner | Italiano Brenda G | $102,000 |
Source: Public Records
Tax History Compared to Growth
Tax History
| Year | Tax Paid | Tax Assessment Tax Assessment Total Assessment is a certain percentage of the fair market value that is determined by local assessors to be the total taxable value of land and additions on the property. | Land | Improvement |
|---|---|---|---|---|
| 2024 | $784 | $78,598 | -- | -- |
| 2023 | $745 | $76,309 | $0 | $0 |
| 2022 | $720 | $74,086 | $0 | $0 |
| 2021 | $726 | $71,928 | $0 | $0 |
| 2020 | $722 | $70,935 | $0 | $0 |
| 2019 | $713 | $69,340 | $0 | $0 |
| 2018 | $712 | $68,047 | $0 | $0 |
| 2017 | $706 | $107,936 | $0 | $0 |
| 2016 | $686 | $64,161 | $0 | $0 |
| 2015 | $669 | $63,715 | $0 | $0 |
| 2014 | $642 | $63,209 | $0 | $0 |
| 2013 | -- | $62,275 | $0 | $0 |
Source: Public Records
Map
Nearby Homes
- 4711 W Vasconia St
- 4710 W El Prado Blvd
- 4625 W El Prado Blvd
- 4718 W Kensington Ave
- 4621 W El Prado Blvd
- 3306 S Omar Ave
- 3605 S Omar Ave
- 3609 S Omar Ave
- 3602 E Renellie Cir
- 3616 S Omar Ave
- 4907 W Spring Lake Dr
- 4636 W Longfellow Ave
- 4642 W Longfellow Ave
- 3623 S Renellie Dr
- 4803 W Longfellow Ave
- 3616 S Lightner Dr
- 5007 W Leona St
- 4807 W Longfellow Ave
- 3626 S Omar Ave
- 3611 W Royal Palm Cir
- 4726 W Cherokee Rd
- 4724 W Cherokee Rd
- 4722 W Cherokee Rd
- 4730 W Cherokee Rd
- 4720 W Cherokee Rd
- 4732 W Cherokee Rd
- 4718 W Cherokee Rd
- 4734 W Cherokee Rd
- 4725 W Vasconia St
- 4736 W Cherokee Rd
- 4727 W Vasconia St
- 4723 W Vasconia St
- 4721 W Vasconia St
- 4729 W Vasconia St
- 4719 W Vasconia St Unit 1
- 4731 W Vasconia St
- 4717 W Vasconia St
- 4738 W Cherokee Rd
- 4735 W Vasconia St
- 4715 W Vasconia St