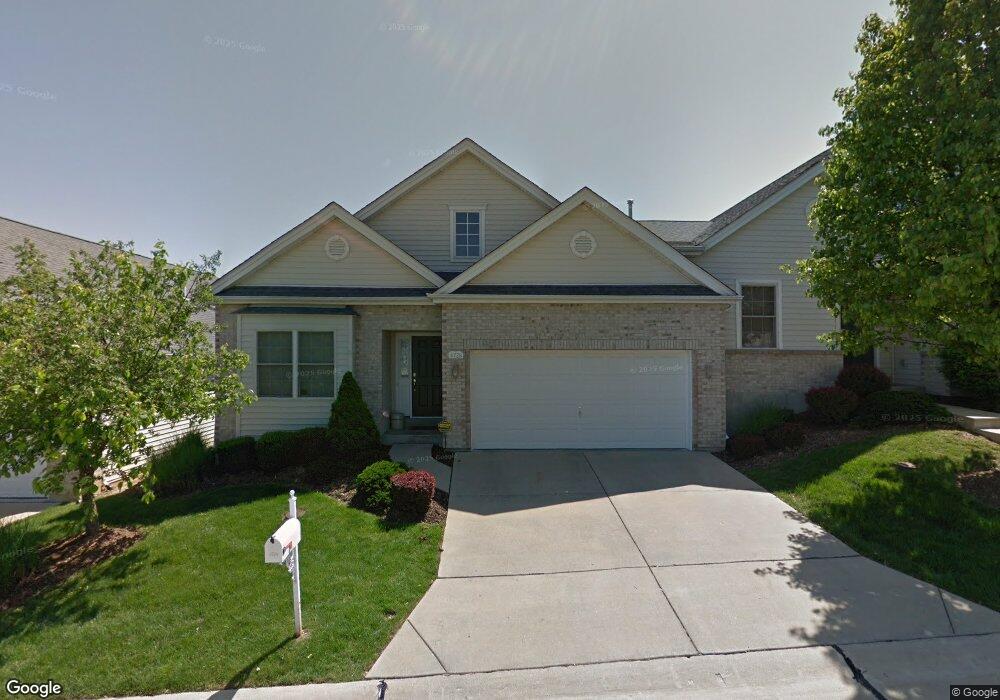
4728 Worthington Way Unit 29 Saint Louis, MO 63128
Estimated Value: $350,000 - $421,845
2
Beds
2
Baths
1,404
Sq Ft
$278/Sq Ft
Est. Value
About This Home
This home is located at 4728 Worthington Way Unit 29, Saint Louis, MO 63128 and is currently estimated at $389,711, approximately $277 per square foot. 4728 Worthington Way Unit 29 is a home located in St. Louis County with nearby schools including Kennerly Elementary School, Sperreng Middle School, and Lindbergh High School.
Ownership History
Date
Name
Owned For
Owner Type
Purchase Details
Closed on
Mar 20, 2007
Sold by
Bonastia Kenneth J and Bonastia Maria
Bought by
Bonastia Kenneth J and Bonastia Maria
Current Estimated Value
Purchase Details
Closed on
May 1, 2006
Sold by
Frein William L
Bought by
Bonastia Kenneth J and Bonastia Maria
Home Financials for this Owner
Home Financials are based on the most recent Mortgage that was taken out on this home.
Original Mortgage
$232,000
Outstanding Balance
$134,057
Interest Rate
6.36%
Mortgage Type
Fannie Mae Freddie Mac
Estimated Equity
$255,654
Purchase Details
Closed on
Jul 31, 2002
Sold by
South Lake Llc
Bought by
Frein William L and Frein Mildred A
Home Financials for this Owner
Home Financials are based on the most recent Mortgage that was taken out on this home.
Original Mortgage
$241,250
Interest Rate
6.53%
Create a Home Valuation Report for This Property
The Home Valuation Report is an in-depth analysis detailing your home's value as well as a comparison with similar homes in the area
Home Values in the Area
Average Home Value in this Area
Purchase History
| Date | Buyer | Sale Price | Title Company |
|---|---|---|---|
| Bonastia Kenneth J | -- | None Available | |
| Bonastia Kenneth J | $290,000 | None Available | |
| Frein William L | $302,399 | -- |
Source: Public Records
Mortgage History
| Date | Status | Borrower | Loan Amount |
|---|---|---|---|
| Open | Bonastia Kenneth J | $232,000 | |
| Previous Owner | Frein William L | $241,250 |
Source: Public Records
Tax History Compared to Growth
Tax History
| Year | Tax Paid | Tax Assessment Tax Assessment Total Assessment is a certain percentage of the fair market value that is determined by local assessors to be the total taxable value of land and additions on the property. | Land | Improvement |
|---|---|---|---|---|
| 2025 | $3,759 | $59,810 | $11,740 | $48,070 |
| 2024 | $3,759 | $57,760 | $8,800 | $48,960 |
| 2023 | $3,750 | $57,760 | $8,800 | $48,960 |
| 2022 | $3,385 | $50,010 | $8,800 | $41,210 |
| 2021 | $3,265 | $50,010 | $8,800 | $41,210 |
| 2020 | $3,166 | $46,780 | $9,600 | $37,180 |
| 2019 | $3,158 | $46,780 | $9,600 | $37,180 |
| 2018 | $3,174 | $42,770 | $5,340 | $37,430 |
| 2017 | $3,140 | $42,770 | $5,340 | $37,430 |
| 2016 | $3,313 | $42,870 | $8,800 | $34,070 |
| 2015 | $3,262 | $42,870 | $8,800 | $34,070 |
| 2014 | $2,709 | $35,190 | $4,330 | $30,860 |
Source: Public Records
Map
Nearby Homes
- 4801 Langtree Dr
- 4645 Tauneybrook Dr
- 5100 Melitta Dr
- 5135 Towne Centre Dr
- 4839 Hursley Dr
- 4833 Hursley Dr
- 4643 Littlebury Dr
- 10033 Carolynne Dr
- 10124 Carolynne Dr
- 12055 Charwick Dr
- 4818 Chapel Hill Dr
- 4942 Caribee Dr
- 10016 Schuessler Rd
- 12015 Charwick Dr
- 4449 Pinyon Jay Ct
- 5057 Peyton Place Ct
- 4931 Theiss Rd
- 4829 Vermilion Dr
- 5102 Peyton Place Ct
- 10652 Roanna Ln
- 4732 Worthington Way Unit 30
- 4724 Worthington Way Unit 28
- 4720 Worthington Way Unit 27
- 117 Worthington Cir Unit 31
- 145 Worthington Cir Unit 13
- 149 Worthington Cir Unit 14
- 4716 Worthington Way Unit 26
- 5100 Worthington Terrace Unit 36
- 153 Worthington Cir Unit 15
- 141 Worthington Cir Unit 12
- 113 Worthington Cir Unit 32
- 124 Worthington Cir Unit 7
- 128 Worthington Cir Unit 8
- 132 Worthington Cir Unit 9
- 120 Worthington Cir Unit 6
- 5104 Worthington Terrace Unit 37
- 157 Worthington Cir Unit 16
- 4712 Worthington Way Unit 25
- 4712 Worthington Way Unit 48
- 116 Worthington Cir Unit 5