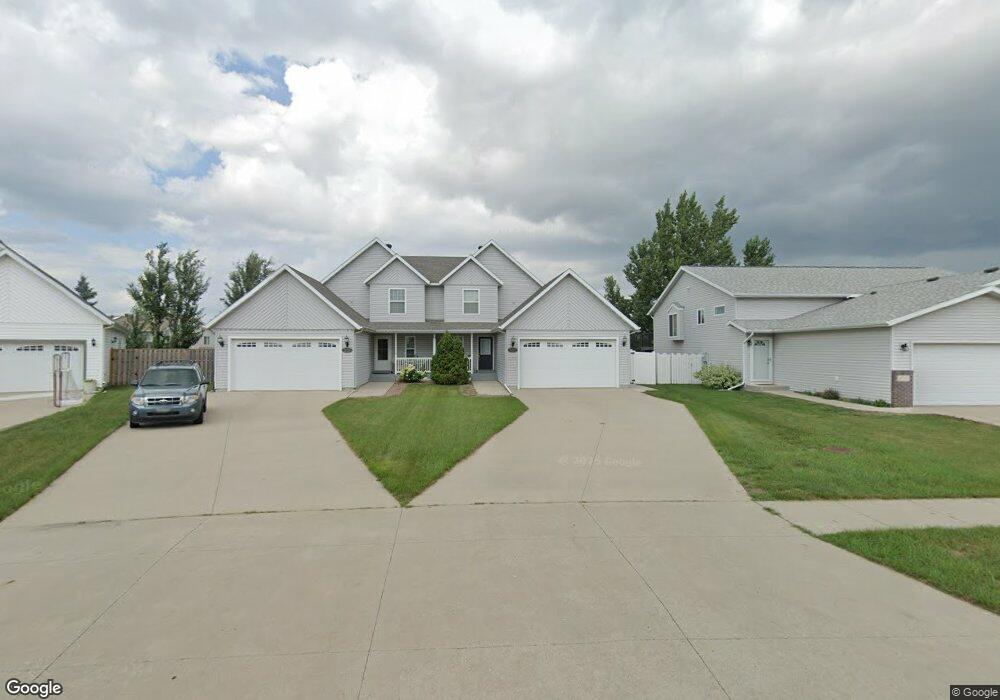
4729 Clock Tower Ln S Fargo, ND 58104
Osgood NeighborhoodEstimated Value: $275,000 - $300,000
3
Beds
3
Baths
2,472
Sq Ft
$116/Sq Ft
Est. Value
About This Home
This home is located at 4729 Clock Tower Ln S, Fargo, ND 58104 and is currently estimated at $286,000, approximately $115 per square foot. 4729 Clock Tower Ln S is a home located in Cass County with nearby schools including Osgood Elementary School, Liberty Middle School, and West Fargo Sheyenne High School.
Ownership History
Date
Name
Owned For
Owner Type
Purchase Details
Closed on
Jun 29, 2023
Sold by
Spilde Eric D and Spilde Rhonda M
Bought by
Mme Properties Llc
Current Estimated Value
Purchase Details
Closed on
May 31, 2019
Sold by
Clark Fred and Clark Linda
Bought by
Spilde Eric D and Spilde Rhonda M
Purchase Details
Closed on
Feb 5, 2019
Sold by
Nelson Donald
Bought by
Clark Fred and Clark Linda
Purchase Details
Closed on
May 31, 2006
Sold by
Hall Anderson Joel A and Hall Anderson Ann
Bought by
Nelson Donald
Home Financials for this Owner
Home Financials are based on the most recent Mortgage that was taken out on this home.
Original Mortgage
$139,200
Interest Rate
8.45%
Mortgage Type
Adjustable Rate Mortgage/ARM
Purchase Details
Closed on
Mar 21, 2004
Sold by
Royal Builders Inc
Bought by
Hall Anderson Joel A and Hall Anderson Ann
Home Financials for this Owner
Home Financials are based on the most recent Mortgage that was taken out on this home.
Original Mortgage
$133,000
Interest Rate
7%
Mortgage Type
Future Advance Clause Open End Mortgage
Create a Home Valuation Report for This Property
The Home Valuation Report is an in-depth analysis detailing your home's value as well as a comparison with similar homes in the area
Home Values in the Area
Average Home Value in this Area
Purchase History
| Date | Buyer | Sale Price | Title Company |
|---|---|---|---|
| Mme Properties Llc | -- | None Listed On Document | |
| Spilde Eric D | $214,900 | Title Co | |
| Clark Fred | $159,276 | None Available | |
| Nelson Donald | $174,000 | -- | |
| Hall Anderson Joel A | -- | -- |
Source: Public Records
Mortgage History
| Date | Status | Borrower | Loan Amount |
|---|---|---|---|
| Previous Owner | Nelson Donald | $139,200 | |
| Previous Owner | Hall Anderson Joel A | $133,000 |
Source: Public Records
Tax History
| Year | Tax Paid | Tax Assessment Tax Assessment Total Assessment is a certain percentage of the fair market value that is determined by local assessors to be the total taxable value of land and additions on the property. | Land | Improvement |
|---|---|---|---|---|
| 2024 | $3,383 | $109,650 | $20,300 | $89,350 |
| 2023 | $3,563 | $118,150 | $18,350 | $99,800 |
| 2022 | $3,689 | $118,150 | $18,350 | $99,800 |
| 2021 | $3,620 | $114,350 | $18,350 | $96,000 |
| 2020 | $3,405 | $106,850 | $18,350 | $88,500 |
| 2019 | $3,361 | $106,850 | $10,200 | $96,650 |
| 2018 | $3,286 | $106,850 | $10,200 | $96,650 |
| 2017 | $3,153 | $104,350 | $10,200 | $94,150 |
| 2016 | $2,840 | $97,500 | $10,200 | $87,300 |
| 2015 | $3,110 | $97,500 | $7,650 | $89,850 |
| 2014 | $2,763 | $81,050 | $7,650 | $73,400 |
| 2013 | $2,750 | $81,050 | $7,650 | $73,400 |
Source: Public Records
Map
Nearby Homes
- 4773 Townsite Place S
- 4788 Clock Tower Ln S
- 4797 Clock Tower Ln S
- 4646 44th Ave S Unit B
- 4304 Estate Dr S
- 4110 52nd St S
- 3760 Merrifield Dr S
- 3724 49th St S
- 3707 Merrifield Dr S
- 4960 37th Ave S
- 3700 Chinook Dr S
- 4512 44th St S
- 3796 Norman Ct S
- 4394 46th Ave S Unit B
- 4303 44th St S
- 3646 Chinook Dr S
- 4486 53rd St S
- 4824 Decorah Way S
- 4749 44th St S
- 4743 Harvest Dr S
- 4731 Clock Tower Ln S
- 4721 Clock Tower Ln S
- 4715 Clock Tower Ln S
- 4771 Townsite Place S
- 4769 Townsite Place S
- 4713 Clock Tower Ln S
- 4735 Clock Tower Ln S
- 4765 Townsite Place S
- 4777 Townsite Place S
- 4707 Clock Tower Ln S
- 4739 Clock Tower Ln S
- 4763 Townsite Place S
- 4779 Townsite Place S
- 4744 Clock Tower Ln S
- 4741 Clock Tower Ln S
- 4761 Townsite Place S
- 4750 Clock Tower Ln S
- 4705 Clock Tower Ln S
- 4309 47th St S
- 4781 Townsite Place S
Your Personal Tour Guide
Ask me questions while you tour the home.