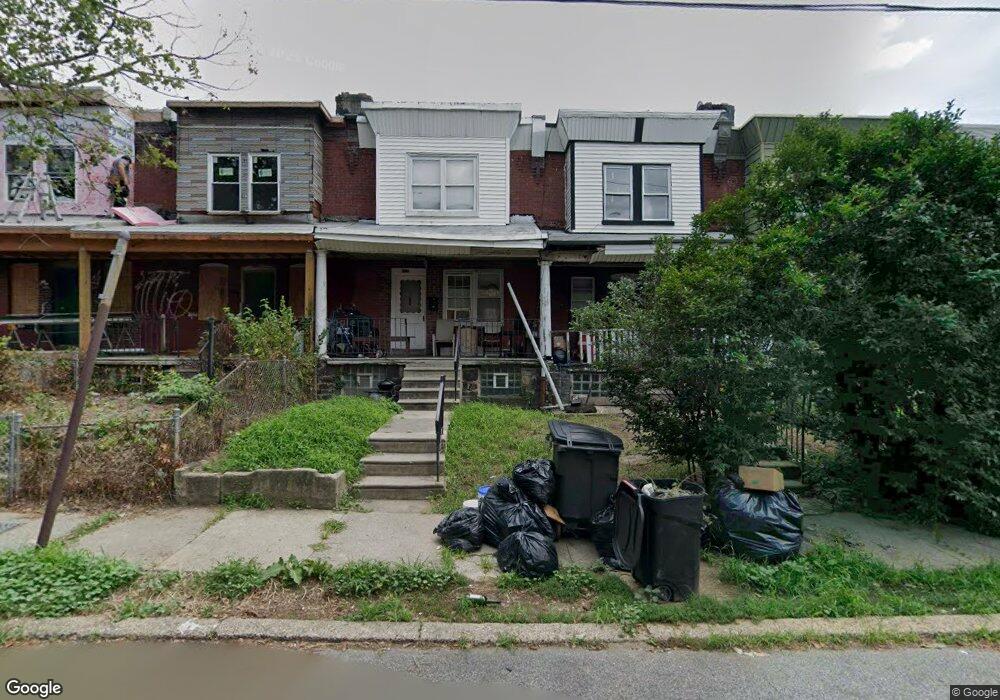
4729 Salem St Philadelphia, PA 19124
Frankford NeighborhoodEstimated Value: $108,000 - $186,582
3
Beds
1
Bath
1,056
Sq Ft
$136/Sq Ft
Est. Value
About This Home
This home is located at 4729 Salem St, Philadelphia, PA 19124 and is currently estimated at $143,646, approximately $136 per square foot. 4729 Salem St is a home located in Philadelphia County with nearby schools including Harding Warren G Middle School, Frankford High School, and Mastery Schools Smedley Elementary.
Ownership History
Date
Name
Owned For
Owner Type
Purchase Details
Closed on
Aug 24, 2020
Sold by
Yrha & A Properties Llc
Bought by
Zhang Natalie
Current Estimated Value
Purchase Details
Closed on
Dec 26, 2017
Sold by
Sharon Alef Proeprties Llc
Bought by
Ybha & A Propertes Llc
Purchase Details
Closed on
Sep 25, 1996
Sold by
Hud
Bought by
Silverman Steven M and Sims Ernest J
Purchase Details
Closed on
Apr 15, 1996
Sold by
Green John D
Bought by
Hud
Create a Home Valuation Report for This Property
The Home Valuation Report is an in-depth analysis detailing your home's value as well as a comparison with similar homes in the area
Home Values in the Area
Average Home Value in this Area
Purchase History
| Date | Buyer | Sale Price | Title Company |
|---|---|---|---|
| Zhang Natalie | $50,000 | Olde City Abstract Inc | |
| Ybha & A Propertes Llc | $30,000 | Assurance Abstract Corp | |
| Silverman Steven M | $9,903 | -- | |
| Hud | $4,300 | -- |
Source: Public Records
Tax History Compared to Growth
Tax History
| Year | Tax Paid | Tax Assessment Tax Assessment Total Assessment is a certain percentage of the fair market value that is determined by local assessors to be the total taxable value of land and additions on the property. | Land | Improvement |
|---|---|---|---|---|
| 2025 | $1,124 | $111,700 | $22,340 | $89,360 |
| 2024 | $1,124 | $111,700 | $22,340 | $89,360 |
| 2023 | $1,124 | $80,300 | $16,060 | $64,240 |
| 2022 | $693 | $80,300 | $16,060 | $64,240 |
| 2021 | $693 | $0 | $0 | $0 |
| 2020 | $693 | $0 | $0 | $0 |
| 2019 | $665 | $0 | $0 | $0 |
| 2018 | $743 | $0 | $0 | $0 |
| 2017 | $743 | $0 | $0 | $0 |
| 2016 | $743 | $0 | $0 | $0 |
| 2015 | $854 | $0 | $0 | $0 |
| 2014 | -- | $63,700 | $15,408 | $48,292 |
| 2012 | -- | $5,760 | $821 | $4,939 |
Source: Public Records
Map
Nearby Homes
- 1629 Foulkrod St
- 4735 Frankford Ave
- 1636 Fillmore St
- 1615 Fillmore St
- 1636 Margaret St
- 1626 Margaret St
- 1519 Foulkrod St
- 4839 Griscom St
- 1515 Foulkrod St
- 4814 Griscom St
- 1688 Fillmore St
- 4712 Griscom St
- 4734 44 Oxford Ave
- 4720 Penn St
- 4666 Duffield St
- 4714 Hawthorne St
- 4636 Hedge St
- 1518 Overington St
- 4665 Leiper St
- 1724 Harrison St