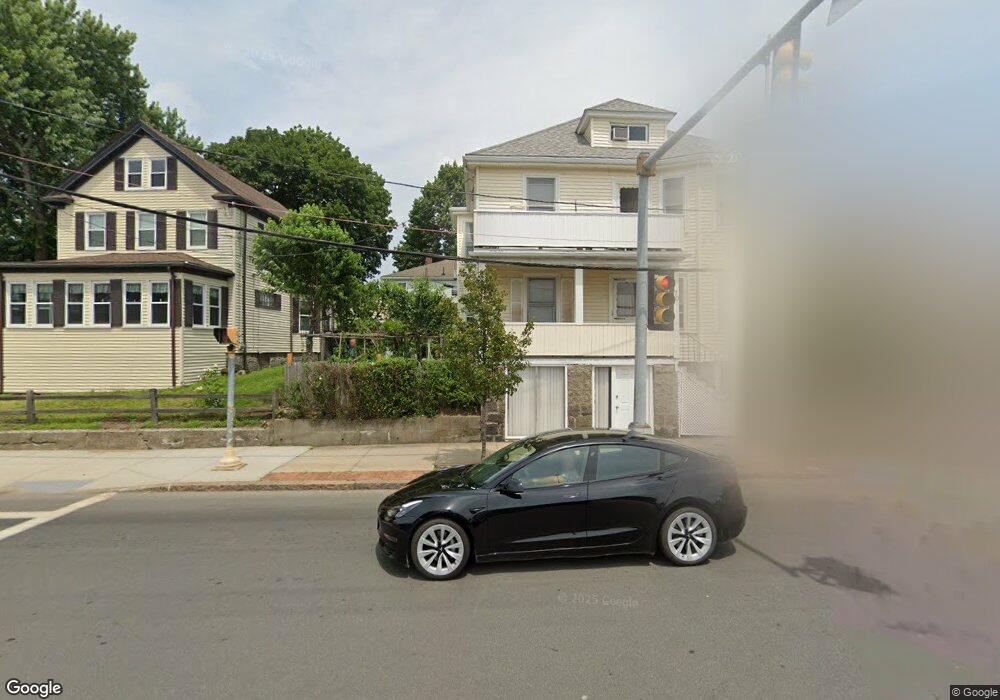
472R Hancock St Quincy, MA 02171
North Quincy NeighborhoodEstimated Value: $804,000 - $1,042,000
5
Beds
3
Baths
2,128
Sq Ft
$443/Sq Ft
Est. Value
About This Home
This home is located at 472R Hancock St, Quincy, MA 02171 and is currently estimated at $942,000, approximately $442 per square foot. 472R Hancock St is a home located in Norfolk County with nearby schools including Francis W. Parker Elementary School, Atlantic Middle School, and North Quincy High School.
Ownership History
Date
Name
Owned For
Owner Type
Purchase Details
Closed on
Feb 21, 2014
Sold by
Jin Xing H
Bought by
Jin Xing H and Shi Yu C
Current Estimated Value
Purchase Details
Closed on
Sep 5, 2001
Sold by
Tam Ricky H and Tam Kendy K
Bought by
Jin Xing H
Home Financials for this Owner
Home Financials are based on the most recent Mortgage that was taken out on this home.
Original Mortgage
$208,800
Interest Rate
7.05%
Mortgage Type
Purchase Money Mortgage
Purchase Details
Closed on
Dec 4, 1997
Sold by
Bourne Eileen L
Bought by
Tam Ricky H and Tam Kendy K
Create a Home Valuation Report for This Property
The Home Valuation Report is an in-depth analysis detailing your home's value as well as a comparison with similar homes in the area
Home Values in the Area
Average Home Value in this Area
Purchase History
| Date | Buyer | Sale Price | Title Company |
|---|---|---|---|
| Jin Xing H | -- | -- | |
| Jin Xing H | $261,000 | -- | |
| Tam Ricky H | $165,000 | -- |
Source: Public Records
Mortgage History
| Date | Status | Borrower | Loan Amount |
|---|---|---|---|
| Previous Owner | Tam Ricky H | $170,000 | |
| Previous Owner | Jin Xing H | $208,800 |
Source: Public Records
Tax History Compared to Growth
Tax History
| Year | Tax Paid | Tax Assessment Tax Assessment Total Assessment is a certain percentage of the fair market value that is determined by local assessors to be the total taxable value of land and additions on the property. | Land | Improvement |
|---|---|---|---|---|
| 2025 | $9,254 | $802,600 | $354,400 | $448,200 |
| 2024 | $8,731 | $774,700 | $334,700 | $440,000 |
| 2023 | $8,225 | $739,000 | $304,300 | $434,700 |
| 2022 | $7,770 | $648,600 | $243,500 | $405,100 |
| 2021 | $7,760 | $639,200 | $243,500 | $395,700 |
| 2020 | $7,387 | $594,300 | $224,700 | $369,600 |
| 2019 | $7,361 | $586,500 | $216,000 | $370,500 |
| 2018 | $6,639 | $497,700 | $218,600 | $279,100 |
| 2017 | $6,605 | $466,100 | $198,700 | $267,400 |
| 2016 | $6,160 | $429,000 | $189,200 | $239,800 |
| 2015 | $5,996 | $410,700 | $177,700 | $233,000 |
| 2014 | $5,564 | $374,400 | $173,800 | $200,600 |
Source: Public Records
Map
Nearby Homes
- 143 Arlington St
- 11 Earle St
- 250 Fayette St
- 17 Holmes St Unit 2
- 17 Holmes St Unit 4
- 101 Beach St
- 6 Warwick St
- 85 E Squantum St Unit 10
- 115 W Squantum St Unit 907
- 115 W Squantum St Unit 810
- 140 Phillips St
- 45 Marion St
- 58 Bayfield Rd S
- 100 Grandview Ave Unit 11A
- 111 Warren Ave Unit 1F
- 163 Clay St Unit C
- 129-131 Pine St
- 22 Newton Ave
- 38 Walker St
- 465 Newport Ave
- 472 Hancock St Unit 2
- 470 Hancock St
- 470 Hancock St Unit 1
- 470 Hancock St Unit 1 470
- 468 Hancock St
- 474 Hancock St
- 476 Hancock St
- 61 Vane St
- 61 Vane St Unit 1
- 55 Vane St
- 57 Vane St
- 55 Vane St Unit 2
- 55 Vane St Unit 55
- 53 Vane St Unit 53
- 51 Vane St
- 51 Vane St Unit 2
- 51 Vane St Unit 51
- 51 Vane St Unit Right
- 480 Hancock St
- 47 Vane St