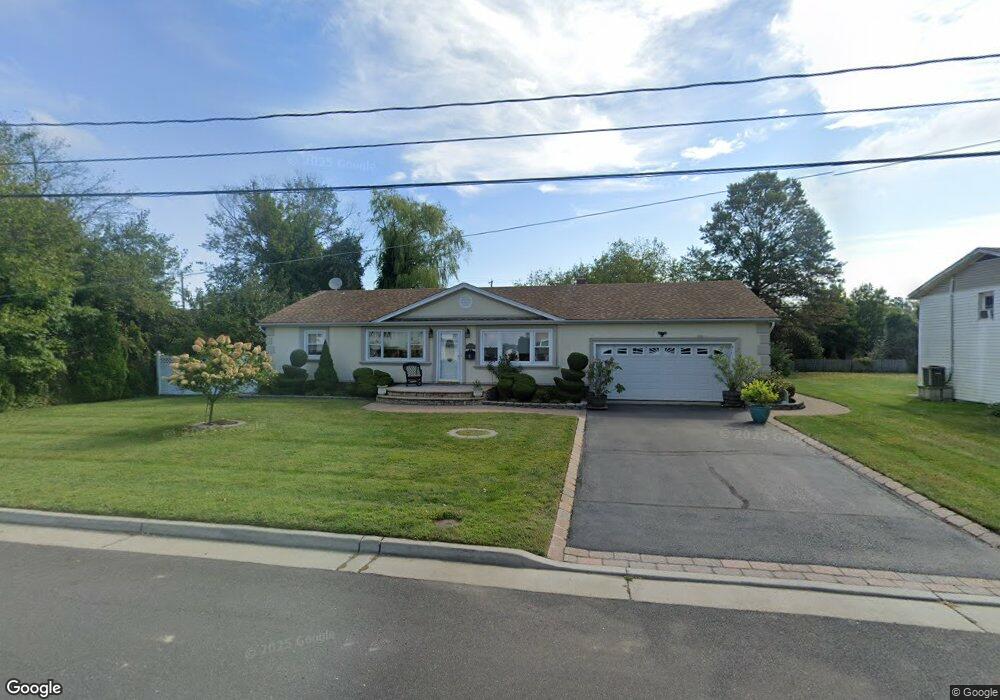
473 Adrian Ave Oceanport, NJ 07757
Estimated Value: $792,997 - $873,000
3
Beds
2
Baths
1,540
Sq Ft
$540/Sq Ft
Est. Value
About This Home
This home is located at 473 Adrian Ave, Oceanport, NJ 07757 and is currently estimated at $832,249, approximately $540 per square foot. 473 Adrian Ave is a home located in Monmouth County with nearby schools including Wolf Hill Elementary School, Maple Place Elementary and Middle School, and Shore Regional High School.
Ownership History
Date
Name
Owned For
Owner Type
Purchase Details
Closed on
Sep 18, 2018
Sold by
Buzzetta Lucrezia
Bought by
Irrevocable Buzzetta Rosalisa and Irrevocable Lucrezia Buzzetta
Current Estimated Value
Purchase Details
Closed on
Dec 18, 2017
Sold by
Buzzetta Trust
Bought by
Buzzetta Lucrezia
Purchase Details
Closed on
Mar 12, 2015
Sold by
Buzzetta Vito and Buzzetta Lucrezia
Bought by
Buzzetta Rosalisa
Purchase Details
Closed on
Sep 15, 2005
Sold by
Mack Philip
Bought by
Buzzetta Vito and Buzzetta Lucrezia
Create a Home Valuation Report for This Property
The Home Valuation Report is an in-depth analysis detailing your home's value as well as a comparison with similar homes in the area
Home Values in the Area
Average Home Value in this Area
Purchase History
| Date | Buyer | Sale Price | Title Company |
|---|---|---|---|
| Irrevocable Buzzetta Rosalisa | -- | None Available | |
| Buzzetta Lucrezia | -- | None Available | |
| Buzzetta Rosalisa | -- | None Available | |
| Buzzetta Vito | $530,000 | -- |
Source: Public Records
Tax History Compared to Growth
Tax History
| Year | Tax Paid | Tax Assessment Tax Assessment Total Assessment is a certain percentage of the fair market value that is determined by local assessors to be the total taxable value of land and additions on the property. | Land | Improvement |
|---|---|---|---|---|
| 2025 | $8,853 | $616,700 | $420,300 | $196,400 |
| 2024 | $8,699 | $560,700 | $372,800 | $187,900 |
| 2023 | $8,699 | $522,800 | $344,300 | $178,500 |
| 2022 | $9,554 | $492,000 | $334,800 | $157,200 |
| 2021 | $9,554 | $501,500 | $330,000 | $171,500 |
| 2020 | $9,028 | $493,900 | $325,300 | $168,600 |
| 2019 | $8,702 | $483,200 | $320,500 | $162,700 |
| 2018 | $8,609 | $481,200 | $320,500 | $160,700 |
| 2017 | $8,455 | $392,000 | $219,500 | $172,500 |
| 2016 | $8,330 | $388,700 | $219,500 | $169,200 |
| 2015 | $8,211 | $395,900 | $231,000 | $164,900 |
| 2014 | $8,227 | $402,300 | $256,000 | $146,300 |
Source: Public Records
Map
Nearby Homes
- 3 Foggia Way
- 10 Asbury Ave
- 66 Shrewsbury Ave
- 1 Carriage House Ln
- 265 Port Au Peck Ave
- 13 Morris Place
- 15 Signal Ave
- 8 Pocahontas Ave
- 94 Paddock Ct
- 14 Oceanport Ave
- 3 Sandbar Aly
- 5 Marine Place
- 580 Patten Ave Unit 31
- 238 Branchport Ave
- 28 Patten Ln
- 572 Jay St
- 565 Joline Ave
- 212 Willow Dr
- 35 Sunnybank Dr
- 631 Irving Place