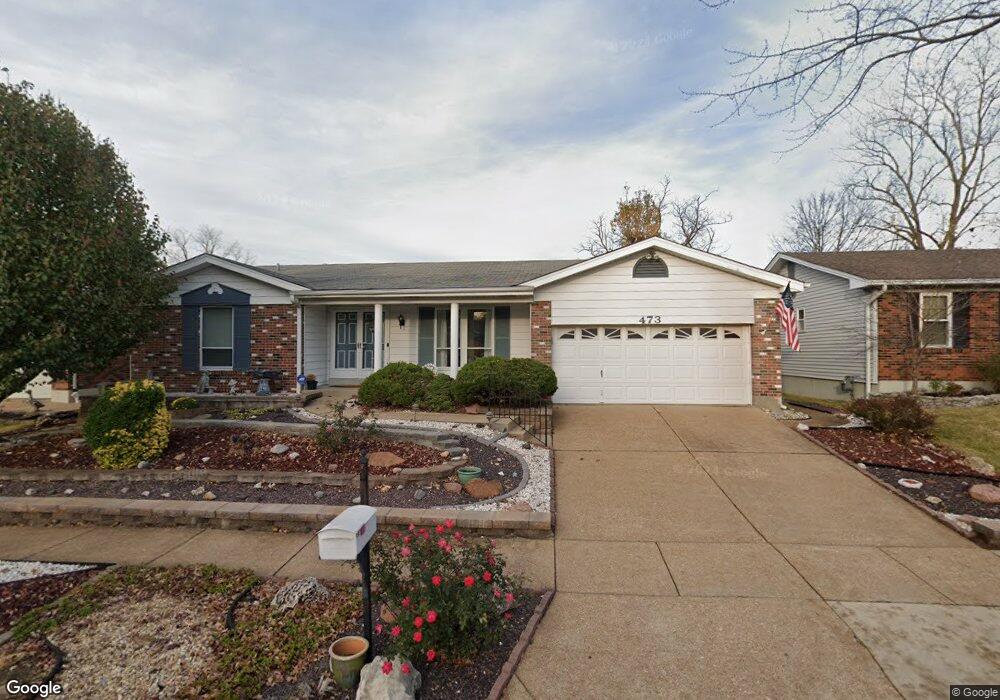
473 Blooming Dale Dr Saint Louis, MO 63125
Mehlville NeighborhoodEstimated Value: $291,000 - $318,000
3
Beds
2
Baths
1,604
Sq Ft
$189/Sq Ft
Est. Value
About This Home
This home is located at 473 Blooming Dale Dr, Saint Louis, MO 63125 and is currently estimated at $303,295, approximately $189 per square foot. 473 Blooming Dale Dr is a home located in St. Louis County with nearby schools including Forder Elementary School, Margaret Buerkle Middle School, and Mehlville High School.
Ownership History
Date
Name
Owned For
Owner Type
Purchase Details
Closed on
Jul 26, 2021
Sold by
Fogelbach Cynthia M
Bought by
Fogelbach Cynthia M and Fogelbach Barton D
Current Estimated Value
Home Financials for this Owner
Home Financials are based on the most recent Mortgage that was taken out on this home.
Original Mortgage
$199,500
Outstanding Balance
$180,707
Interest Rate
2.93%
Mortgage Type
New Conventional
Estimated Equity
$122,588
Purchase Details
Closed on
Aug 18, 1999
Sold by
Vien Francis H & Arlene M Trustees
Bought by
Vien Francis H and Vien Arlene M
Home Financials for this Owner
Home Financials are based on the most recent Mortgage that was taken out on this home.
Original Mortgage
$80,000
Interest Rate
7.86%
Purchase Details
Closed on
Aug 12, 1998
Sold by
Vien Francis H and Vien Arlene M
Bought by
Vien Francis H and Vien Arlene M
Create a Home Valuation Report for This Property
The Home Valuation Report is an in-depth analysis detailing your home's value as well as a comparison with similar homes in the area
Home Values in the Area
Average Home Value in this Area
Purchase History
| Date | Buyer | Sale Price | Title Company |
|---|---|---|---|
| Fogelbach Cynthia M | -- | Continental Title | |
| Fogelbach Cynthia M | $210,000 | Continental Title Holding Co | |
| Fogelbach Cynthia M | -- | Continental Title | |
| Vien Francis H | -- | First American Title | |
| Vien Francis H | -- | -- |
Source: Public Records
Mortgage History
| Date | Status | Borrower | Loan Amount |
|---|---|---|---|
| Open | Fogelbach Cynthia M | $199,500 | |
| Closed | Fogelbach Cynthia M | $199,500 | |
| Previous Owner | Vien Francis H | $80,000 |
Source: Public Records
Tax History Compared to Growth
Tax History
| Year | Tax Paid | Tax Assessment Tax Assessment Total Assessment is a certain percentage of the fair market value that is determined by local assessors to be the total taxable value of land and additions on the property. | Land | Improvement |
|---|---|---|---|---|
| 2025 | $3,090 | $49,270 | $15,410 | $33,860 |
| 2024 | $3,090 | $45,540 | $8,470 | $37,070 |
| 2023 | $3,090 | $45,540 | $8,470 | $37,070 |
| 2022 | $2,931 | $40,620 | $8,470 | $32,150 |
| 2021 | $2,601 | $40,620 | $8,470 | $32,150 |
| 2020 | $2,463 | $36,570 | $10,030 | $26,540 |
| 2019 | $2,456 | $36,570 | $10,030 | $26,540 |
| 2018 | $2,347 | $31,540 | $6,780 | $24,760 |
| 2017 | $2,343 | $31,540 | $6,780 | $24,760 |
| 2016 | $2,303 | $29,730 | $6,780 | $22,950 |
| 2015 | $2,159 | $29,730 | $6,780 | $22,950 |
| 2014 | $2,094 | $28,540 | $6,020 | $22,520 |
Source: Public Records
Map
Nearby Homes
- 851 Poplar Dr
- 904 Victory Dr
- 725 Buckley Rd
- 701 Chevron Dr
- 3151 Lin Tel Rd
- 2907 Hubert Dr
- 4061 Morningview Ct
- 3105 Lin Tel Rd
- 1104 Brookville Ct
- 35 Berview Cir Unit E
- 1 Berview Cir Unit B
- 2825 Telegraph Rd
- 9 Berview Cir Unit H
- 4248 Kingbolt Blvd Unit D
- 2959 Annunciation Dr
- 2669 Jonathan Dr
- 2745 Granda Dr
- 1141 Sunbolt Dr Unit C
- 517 Aqua Ridge Dr
- 3724 Southern Manor Dr
- 479 Blooming Dale Dr
- 467 Blooming Dale Dr
- 461 Blooming Dale Dr
- 485 Blooming Dale Dr
- 472 Blooming Dale Dr
- 466 Blooming Dale Dr
- 455 Blooming Dale Dr
- 491 Blooming Dale Dr
- 458 Blooming Dale Dr
- 478 Blooming Dale Dr
- 490 Blooming Dale Dr
- 539 Blossomheath Dr
- 531 Blossomheath Dr
- 449 Blooming Dale Dr
- 484 Blooming Dale Dr
- 545 Blossomheath Dr
- 553 Blossomheath Dr
- 605 Buckley Rd
- 609 Buckley Rd
- 443 Blooming Dale Dr