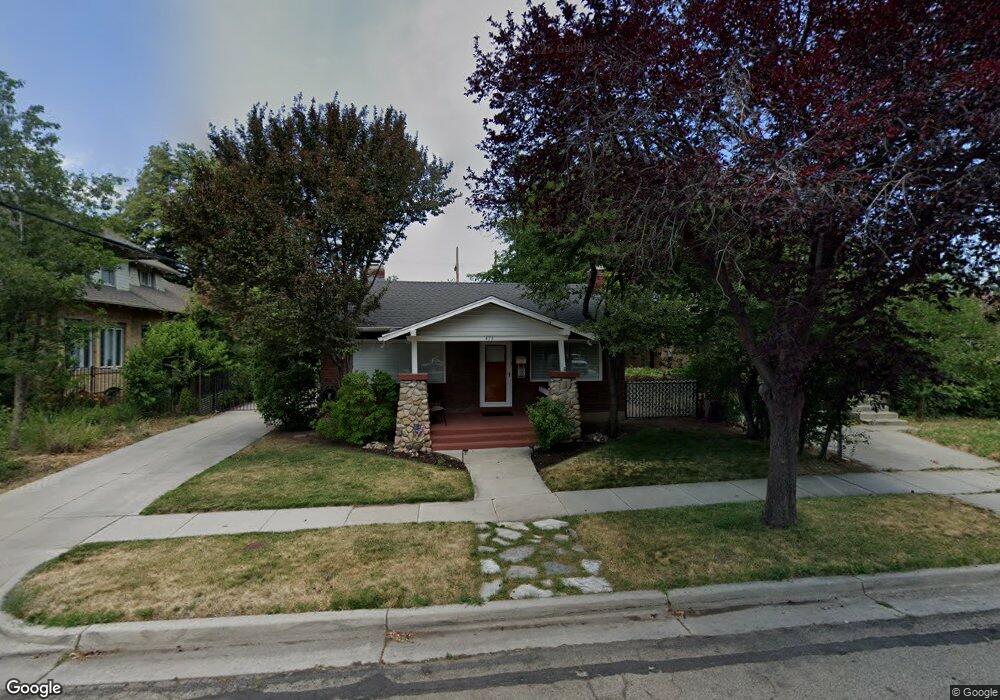
473 Bryan Ave Salt Lake City, UT 84115
Liberty Wells NeighborhoodEstimated Value: $466,000 - $540,126
2
Beds
1
Bath
724
Sq Ft
$684/Sq Ft
Est. Value
About This Home
This home is located at 473 Bryan Ave, Salt Lake City, UT 84115 and is currently estimated at $495,532, approximately $684 per square foot. 473 Bryan Ave is a home located in Salt Lake County with nearby schools including Whittier Elementary School, Hillside Middle School, and Highland High School.
Ownership History
Date
Name
Owned For
Owner Type
Purchase Details
Closed on
Feb 27, 2023
Sold by
May Joseph R
Bought by
Turner Julie A
Current Estimated Value
Purchase Details
Closed on
Jan 18, 2023
Sold by
May Joseph R
Bought by
Turner Julie A
Purchase Details
Closed on
Jan 22, 2003
Sold by
Turner V Kent
Bought by
Turner V Kent and Turner Julie Anne
Home Financials for this Owner
Home Financials are based on the most recent Mortgage that was taken out on this home.
Original Mortgage
$100,479
Interest Rate
5.96%
Purchase Details
Closed on
Jun 21, 2001
Sold by
Turner V Kent
Bought by
Turner V Kent and Turner Julie Anne
Purchase Details
Closed on
Nov 29, 1999
Sold by
Turner V Kent
Bought by
Turner V Kent and Turner Julie Anne
Home Financials for this Owner
Home Financials are based on the most recent Mortgage that was taken out on this home.
Original Mortgage
$102,000
Interest Rate
7.84%
Purchase Details
Closed on
Dec 8, 1993
Sold by
Johnson Dorothy E and Johnson Elwood J
Bought by
Benham Johneen E
Home Financials for this Owner
Home Financials are based on the most recent Mortgage that was taken out on this home.
Original Mortgage
$54,538
Interest Rate
6.89%
Mortgage Type
FHA
Create a Home Valuation Report for This Property
The Home Valuation Report is an in-depth analysis detailing your home's value as well as a comparison with similar homes in the area
Home Values in the Area
Average Home Value in this Area
Purchase History
| Date | Buyer | Sale Price | Title Company |
|---|---|---|---|
| Turner Julie A | -- | -- | |
| Turner Julie A | -- | -- | |
| Turner V Kent | -- | Title One | |
| Turner V Kent | -- | Title One | |
| Turner V Kent | -- | Title One | |
| Turner V Kent | -- | Title One | |
| Turner V Kent | -- | Paramount Title | |
| Turner V Kent | -- | Paramount Title | |
| Benham Johneen E | -- | Backman Stewart Title |
Source: Public Records
Mortgage History
| Date | Status | Borrower | Loan Amount |
|---|---|---|---|
| Previous Owner | Turner V Kent | $100,479 | |
| Previous Owner | Turner V Kent | $102,000 | |
| Previous Owner | Benham Johneen E | $54,538 |
Source: Public Records
Tax History Compared to Growth
Tax History
| Year | Tax Paid | Tax Assessment Tax Assessment Total Assessment is a certain percentage of the fair market value that is determined by local assessors to be the total taxable value of land and additions on the property. | Land | Improvement |
|---|---|---|---|---|
| 2025 | $2,347 | $479,700 | $185,000 | $294,700 |
| 2024 | $2,347 | $447,800 | $175,100 | $272,700 |
| 2023 | $1,925 | $354,000 | $168,300 | $185,700 |
| 2022 | $2,111 | $364,200 | $165,000 | $199,200 |
| 2021 | $1,880 | $293,700 | $108,900 | $184,800 |
| 2020 | $1,805 | $268,400 | $99,000 | $169,400 |
| 2019 | $1,843 | $257,900 | $89,300 | $168,600 |
| 2018 | $1,777 | $242,100 | $89,300 | $152,800 |
| 2017 | $1,623 | $207,200 | $89,300 | $117,900 |
| 2016 | $1,579 | $191,400 | $75,100 | $116,300 |
| 2015 | $1,521 | $174,700 | $69,200 | $105,500 |
| 2014 | $1,471 | $167,600 | $67,800 | $99,800 |
Source: Public Records
Map
Nearby Homes
- 438 Bryan Ave
- 1612 S 500 E Unit 1614
- 359 Bryan Ave
- 557 E Cleveland Ave
- 1479 S 600 E
- 1633 S 300 E
- 432 E Harrison Ave
- 1763 S 400 E
- 1476 S 300 E
- 1349 S 500 E
- 1804 S Park St
- 1401 S 300 E
- 349 E Coatsville Ave
- 327 E Coatsville Ave
- 363 E Downington Ave
- 414 Downington Ave S
- 1848 S 500 E
- 1436 S Roberta St
- 1856 S 500 E
- 1797 S 300 E
- 477 Bryan Ave
- 465 Bryan Ave
- 1536 S 500 E
- 1546 S 500 E
- 457 E Bryan Ave
- 457 Bryan Ave
- 1556 S 500 E
- 1554 S 500 E
- 472 E Kensington Ave
- 462 Kensington Ave
- 472 Bryan Ave
- 1532 S 500 E
- 472 E Bryan Ave
- 451 E Bryan Ave
- 451 Bryan Ave
- 458 Kensington Ave
- 458 E Kensington Ave
- 462 Bryan Ave Unit 466
- 1574 S 500 E
- 454 E Kensington Ave