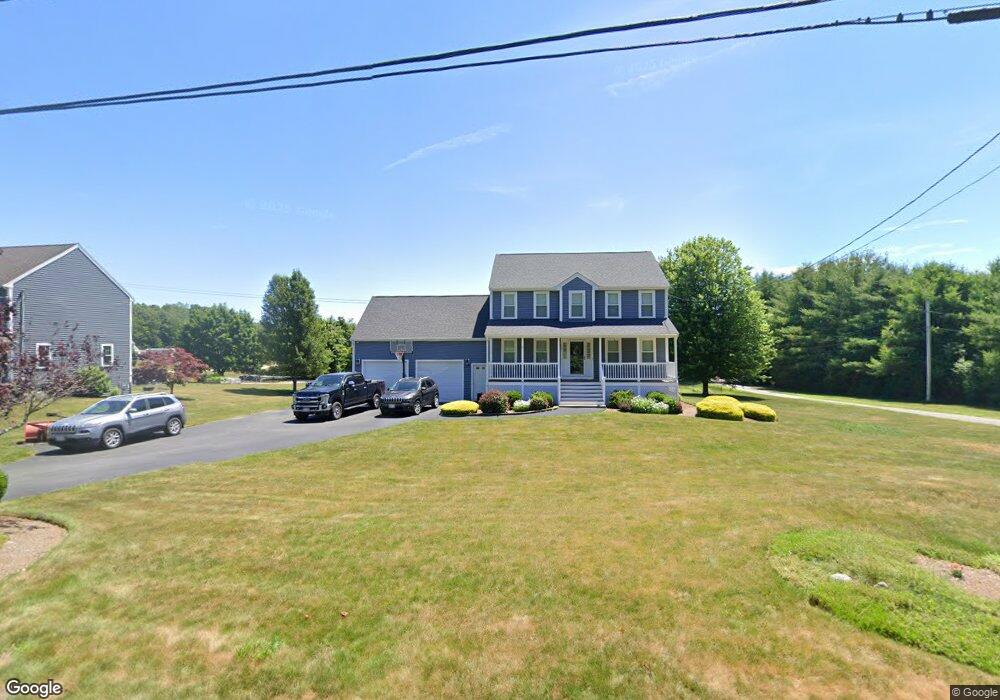
473 Cedar St East Bridgewater, MA 02333
Estimated Value: $691,547 - $857,000
3
Beds
3
Baths
1,802
Sq Ft
$430/Sq Ft
Est. Value
About This Home
This home is located at 473 Cedar St, East Bridgewater, MA 02333 and is currently estimated at $774,887, approximately $430 per square foot. 473 Cedar St is a home located in Plymouth County with nearby schools including Central Elementary School, Gordon W Mitchell Middle School, and East Bridgewater Jr./Sr. High School.
Ownership History
Date
Name
Owned For
Owner Type
Purchase Details
Closed on
Feb 14, 2008
Sold by
Mcmanus Michelle and Mcmanus Christopher D
Bought by
Amaral Edward A and Garvey-Amaral Judith A
Current Estimated Value
Home Financials for this Owner
Home Financials are based on the most recent Mortgage that was taken out on this home.
Original Mortgage
$195,000
Interest Rate
6.14%
Mortgage Type
Purchase Money Mortgage
Purchase Details
Closed on
Jul 27, 2001
Sold by
Keefe Irene E and Keefe Patrick S
Bought by
Mcmanus Christopher D and Mcmanus Michelle M
Purchase Details
Closed on
Dec 16, 1998
Sold by
Salvucci Daniel A
Bought by
Keefe Patrick S and Keefe Irene E
Purchase Details
Closed on
May 5, 1998
Sold by
Johnson Edward G
Bought by
Salvucci Daniel A
Create a Home Valuation Report for This Property
The Home Valuation Report is an in-depth analysis detailing your home's value as well as a comparison with similar homes in the area
Home Values in the Area
Average Home Value in this Area
Purchase History
| Date | Buyer | Sale Price | Title Company |
|---|---|---|---|
| Amaral Edward A | $365,500 | -- | |
| Mcmanus Christopher D | $289,900 | -- | |
| Keefe Patrick S | $189,900 | -- | |
| Salvucci Daniel A | $68,000 | -- |
Source: Public Records
Mortgage History
| Date | Status | Borrower | Loan Amount |
|---|---|---|---|
| Open | Salvucci Daniel A | $205,000 | |
| Closed | Salvucci Daniel A | $195,000 |
Source: Public Records
Tax History Compared to Growth
Tax History
| Year | Tax Paid | Tax Assessment Tax Assessment Total Assessment is a certain percentage of the fair market value that is determined by local assessors to be the total taxable value of land and additions on the property. | Land | Improvement |
|---|---|---|---|---|
| 2025 | $7,966 | $582,700 | $186,800 | $395,900 |
| 2024 | $7,827 | $565,500 | $179,600 | $385,900 |
| 2023 | $7,615 | $527,000 | $179,600 | $347,400 |
| 2022 | $7,401 | $474,400 | $163,400 | $311,000 |
| 2021 | $7,231 | $424,100 | $157,000 | $267,100 |
| 2020 | $7,108 | $411,100 | $151,000 | $260,100 |
| 2019 | $5,114 | $395,300 | $144,300 | $251,000 |
| 2018 | $6,757 | $376,200 | $144,300 | $231,900 |
| 2017 | $6,612 | $361,300 | $137,600 | $223,700 |
| 2016 | $6,400 | $352,400 | $137,600 | $214,800 |
| 2015 | $6,358 | $358,000 | $136,600 | $221,400 |
| 2014 | $6,146 | $353,800 | $133,800 | $220,000 |
Source: Public Records
Map
Nearby Homes
- 1247 Central St
- 9 Daisy Ln
- 170 Elm St
- 5 Della Way
- 844 Washington St
- 80 Phillips St
- 72 Phillips St
- 936 Central St
- 1054 Main St
- 1 Simmons Place
- 182 Crystal Water Dr Unit 182
- 217 Crystal Water Dr
- 28 Brookbend Way E
- 22 Hudson St
- 78 Crystal Water Dr
- 1993 Washington St
- 51 Stonegate Dr
- 71 Stonegate Dr
- 14 Mountain Ash Rd
- 587 Bridge St