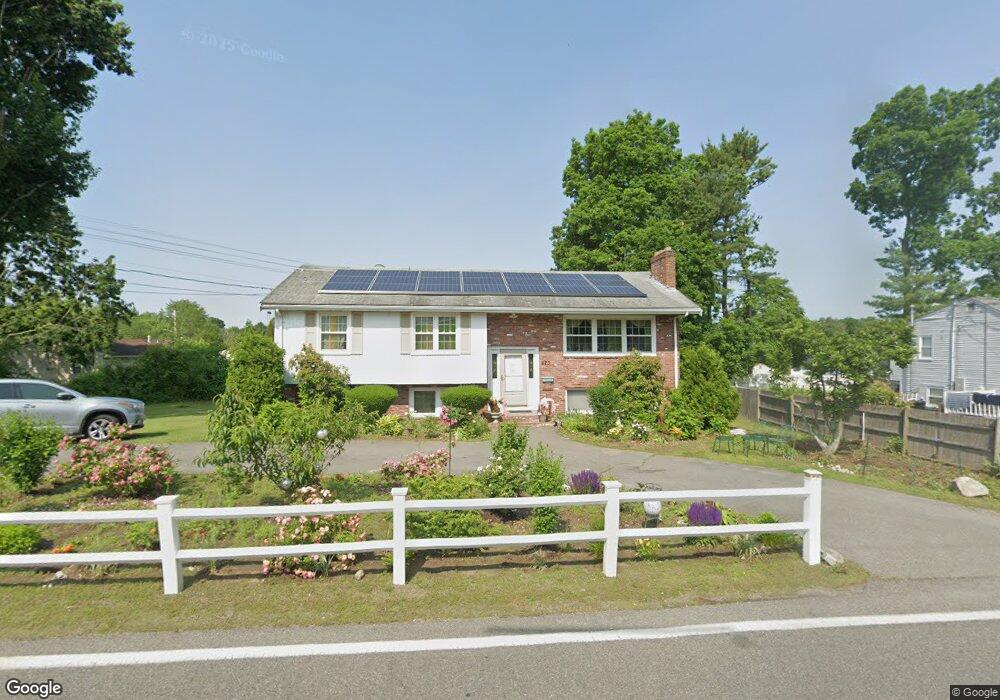
473 East St Brockton, MA 02302
Estimated Value: $549,000 - $566,571
5
Beds
2
Baths
1,242
Sq Ft
$450/Sq Ft
Est. Value
About This Home
This home is located at 473 East St, Brockton, MA 02302 and is currently estimated at $559,393, approximately $450 per square foot. 473 East St is a home located in Plymouth County with nearby schools including Davis K-8 School, John F. Kennedy Elementary School, and South Middle School.
Ownership History
Date
Name
Owned For
Owner Type
Purchase Details
Closed on
Jul 25, 2003
Sold by
Dominique Rene M
Bought by
Jonassaint Yves-Rose and Jonassaint Samuel
Current Estimated Value
Home Financials for this Owner
Home Financials are based on the most recent Mortgage that was taken out on this home.
Original Mortgage
$237,500
Interest Rate
5.27%
Mortgage Type
Purchase Money Mortgage
Purchase Details
Closed on
Jan 30, 1998
Sold by
Ricci Adeline
Bought by
Dominique Rene M
Create a Home Valuation Report for This Property
The Home Valuation Report is an in-depth analysis detailing your home's value as well as a comparison with similar homes in the area
Home Values in the Area
Average Home Value in this Area
Purchase History
| Date | Buyer | Sale Price | Title Company |
|---|---|---|---|
| Jonassaint Yves-Rose | $250,000 | -- | |
| Dominique Rene M | $119,500 | -- |
Source: Public Records
Mortgage History
| Date | Status | Borrower | Loan Amount |
|---|---|---|---|
| Open | Dominique Rene M | $263,200 | |
| Closed | Dominique Rene M | $32,900 | |
| Closed | Dominique Rene M | $237,500 | |
| Previous Owner | Dominique Rene M | $24,000 |
Source: Public Records
Tax History Compared to Growth
Tax History
| Year | Tax Paid | Tax Assessment Tax Assessment Total Assessment is a certain percentage of the fair market value that is determined by local assessors to be the total taxable value of land and additions on the property. | Land | Improvement |
|---|---|---|---|---|
| 2025 | $5,812 | $479,900 | $165,800 | $314,100 |
| 2024 | $5,589 | $465,000 | $165,800 | $299,200 |
| 2023 | $5,468 | $421,300 | $116,400 | $304,900 |
| 2022 | $4,920 | $352,200 | $105,800 | $246,400 |
| 2021 | $4,763 | $328,500 | $99,400 | $229,100 |
| 2020 | $4,571 | $301,700 | $86,600 | $215,100 |
| 2019 | $4,496 | $289,300 | $83,300 | $206,000 |
| 2018 | $4,330 | $269,600 | $83,300 | $186,300 |
| 2017 | $3,838 | $238,400 | $83,300 | $155,100 |
| 2016 | $3,805 | $219,200 | $79,400 | $139,800 |
| 2015 | $3,574 | $196,900 | $79,400 | $117,500 |
| 2014 | $3,301 | $182,100 | $79,400 | $102,700 |
Source: Public Records
Map
Nearby Homes